
As I’ve been highlighting in recent videos, the inverse correlation between the price of crude oil & the stock market is about as tight as it gets. As such, these trade setups (not actionable or current trades, but a setup pending sell signals) will either make or break this rally, as well as the potential for QQQ to hit my bounce target zone.
/CL (crude oil futures or /QM (MINY futures) or /MCL (Micro futures) sell signal pending a solid 60m candlestick close back below the 101.73 former resistance, now support level. Solid arrows, should the sell signal trigger, are my current price targets, with the dotted arrow a potential target at this time. 60-minute chart below.
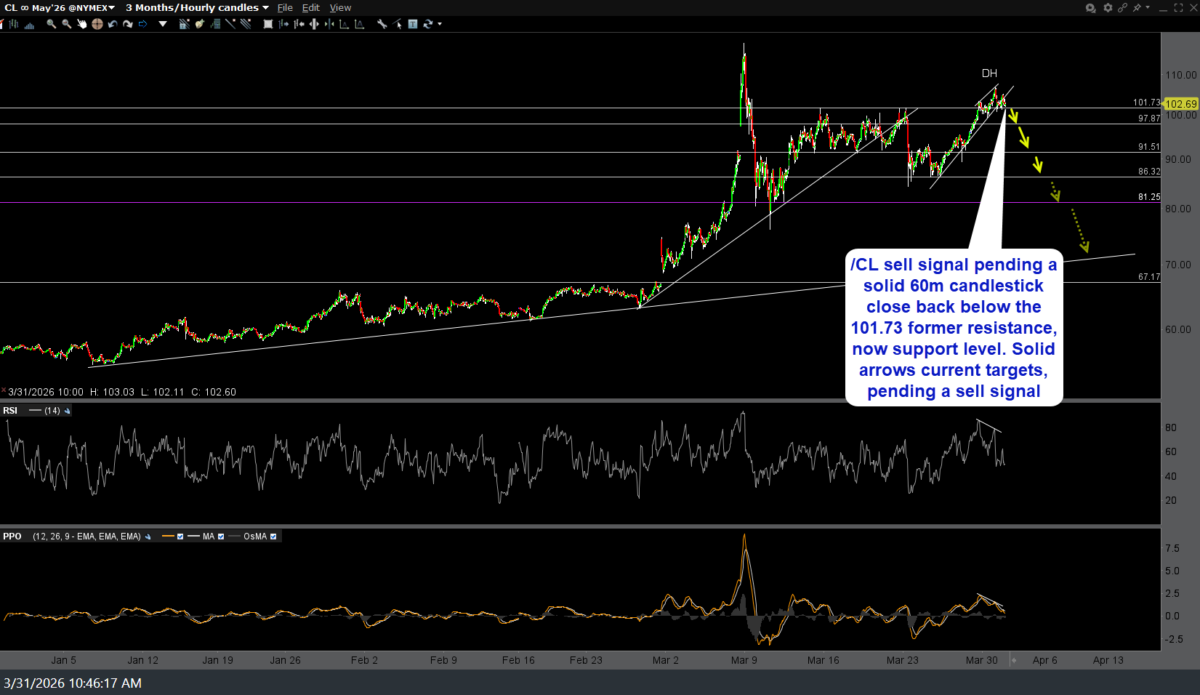
CL 60m March 31st
For ETP traders, USO (crude oil ETN or SCO, -2x short crude, etc…) sell signals pending solid breaks below this uptrend line & then the 124 support level. Solid arrows are my current targets, assuming the aforementioned sell signals are triggered, with the dotted arrow a potential target). 60-minute chart below.
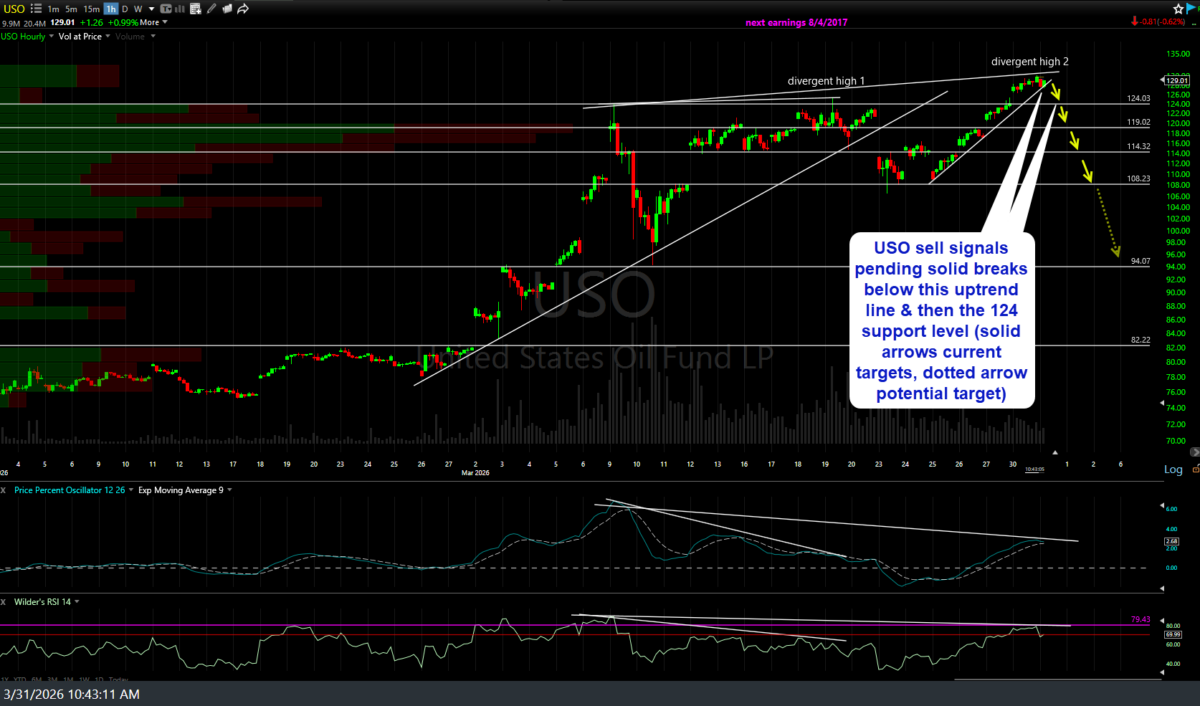
USO 60m March 31st
For those that missed any of the comparisons between crude & the stock market covered in recent videos, the lock-step inverse correlation between the stock market (SPY, candlesticks) and crude oil (inverted using SCO, to show the correlation more easily) remains very much intact, including on today’s hard reversal in both in this 1-minute chart.
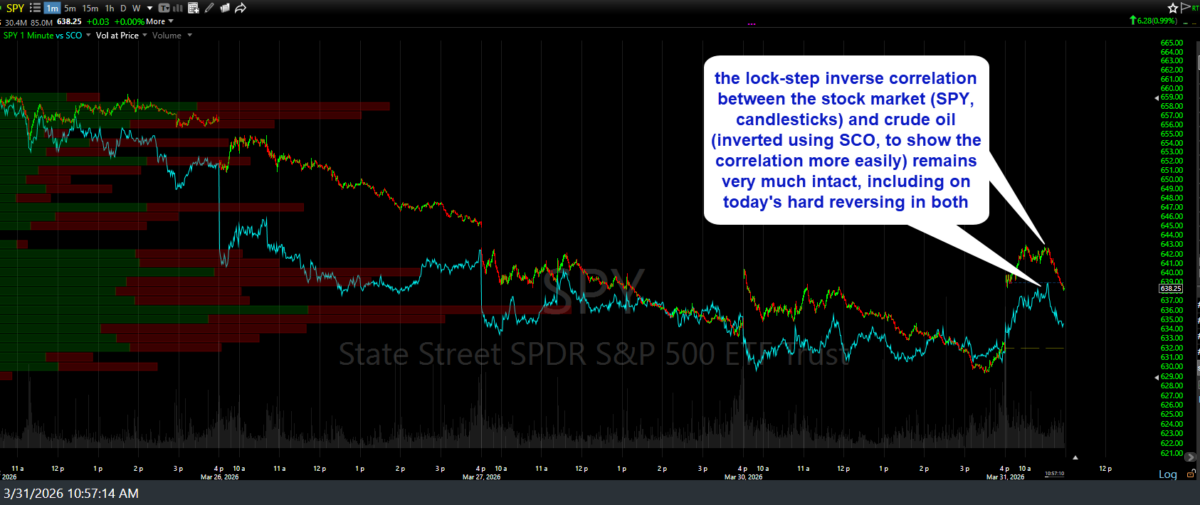
SPY vs SCO 1m March 31st
As such, the aforementioned sell signals on crude will also be buy signals (objective add-ons, re-entries, or new long entry) on stock index longs or related equity positions.