
A solid break and/or 60-minute candlestick close above this downtrend line would likely spark a rally in /CL (crude oil futures) up to the 52ish resistance zone & if so, that should help to firm up the case of a major reversal on the more significant daily chart.
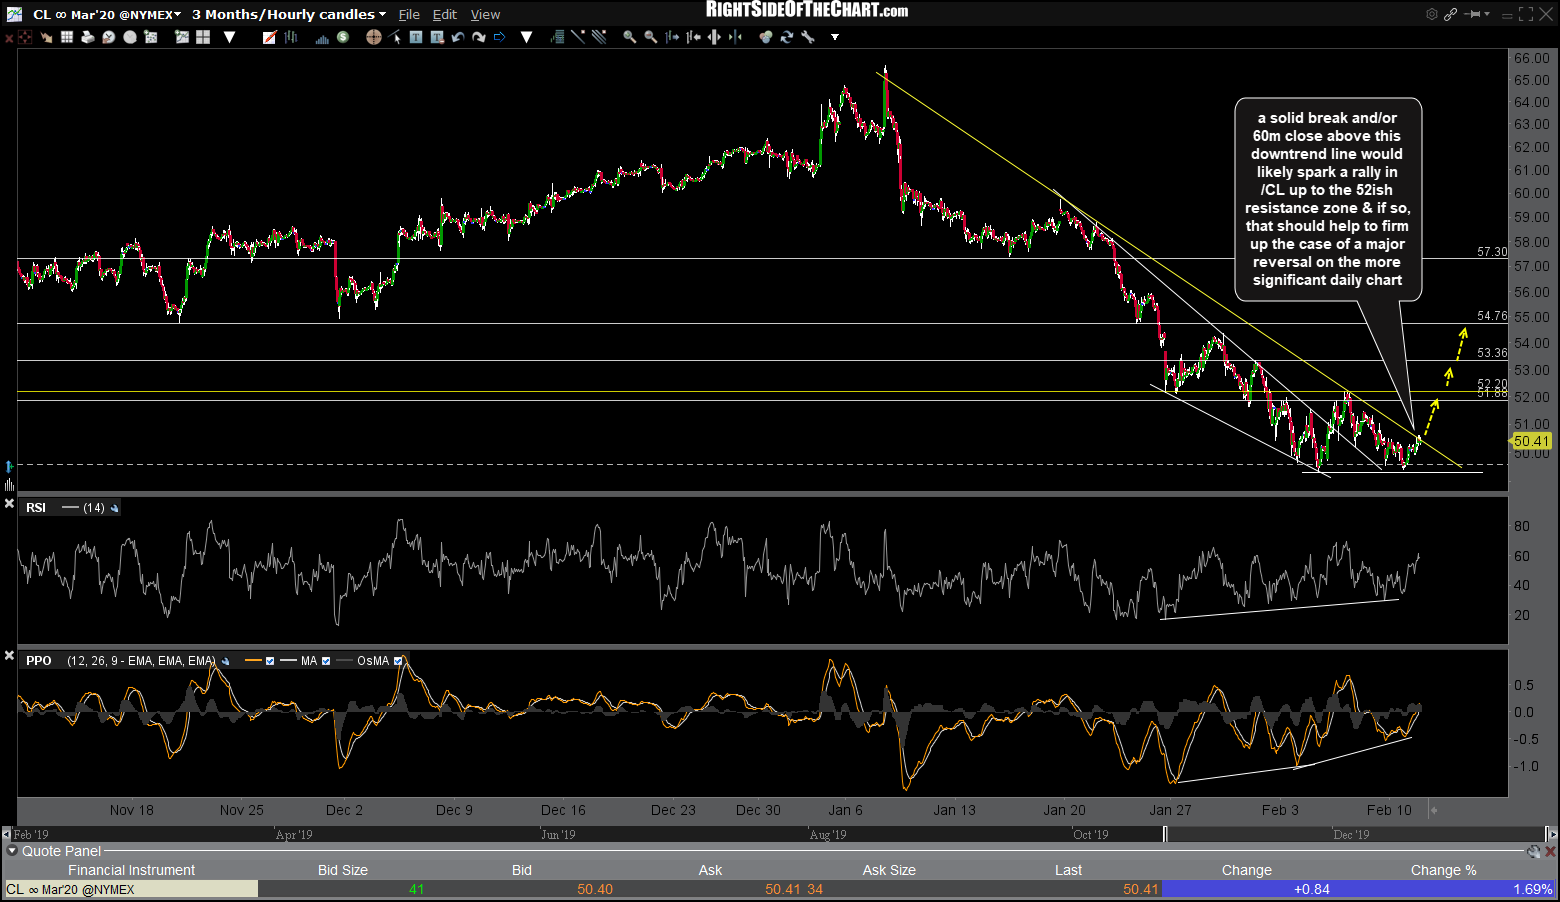
CL 60m Feb 11th
Meanwhile, the USO (crude oil ETN) Active Long Swing Trade is hanging in there, for now, remaining above the suggested stop as crude oil continues to hold long-term support & the bullish divergences continue to build.
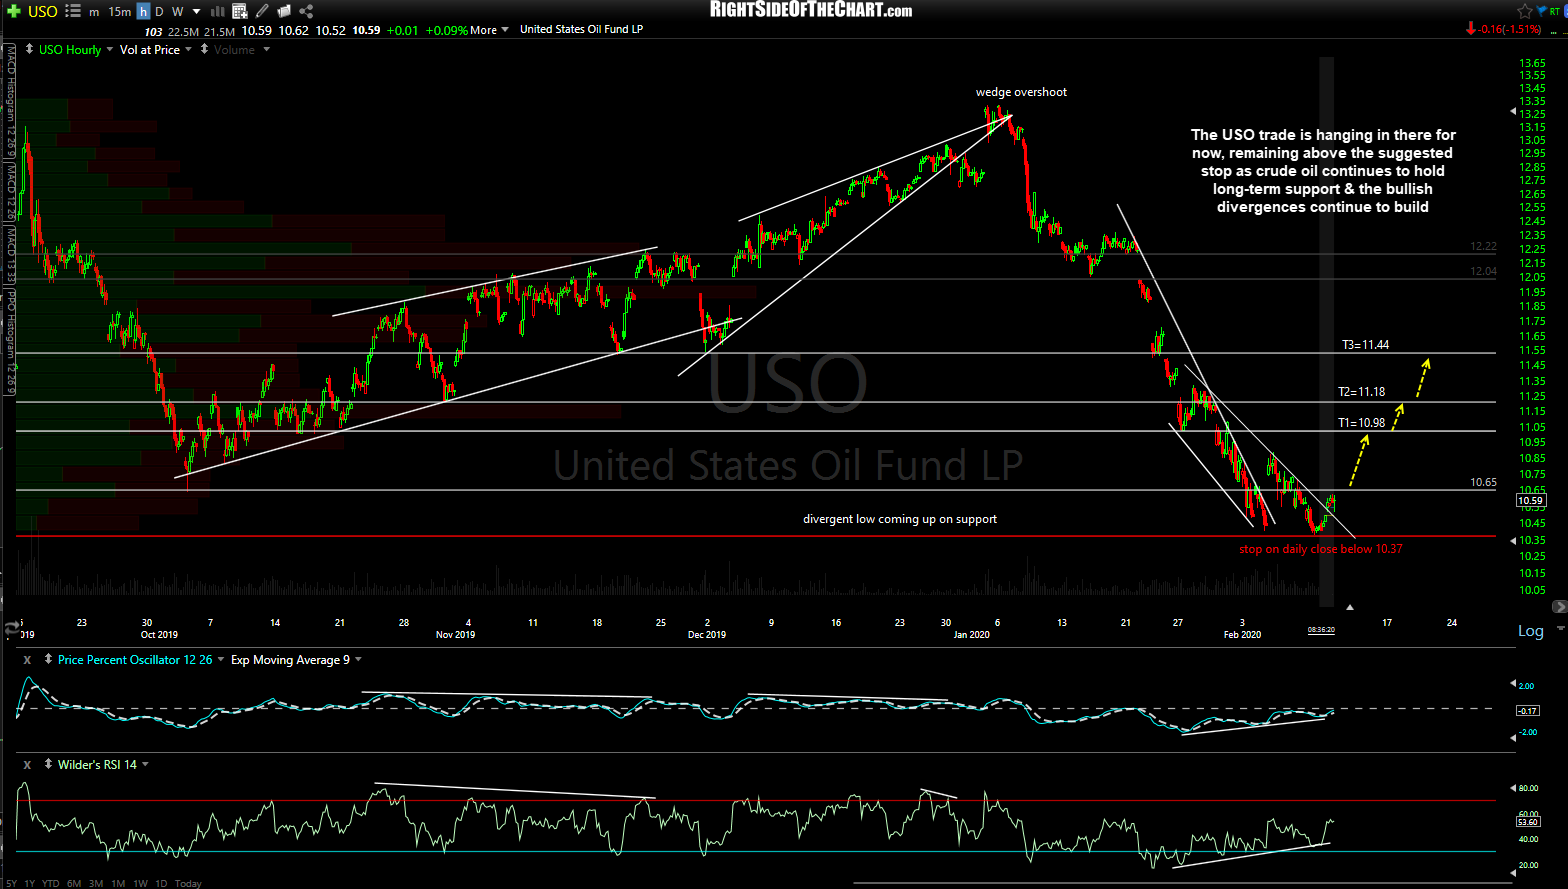
USO 60m Feb 11th
The daily chart below illustrates the typically tight positive correlation between the stock market (SPY, S&P 500 ETF) and crude oil (USO, crude ETN) as both tend to ebb and flow with current economic conditions & future expectations. The recent disconnect between the stock market & crude oil has is the most pronounced divergence since the comparable divergence back in mid-2017. That divergence was followed by one of the strongest & longest rallies in crude oil in decades, with crude playing a very swift & strong game of catch-up to the stock market.
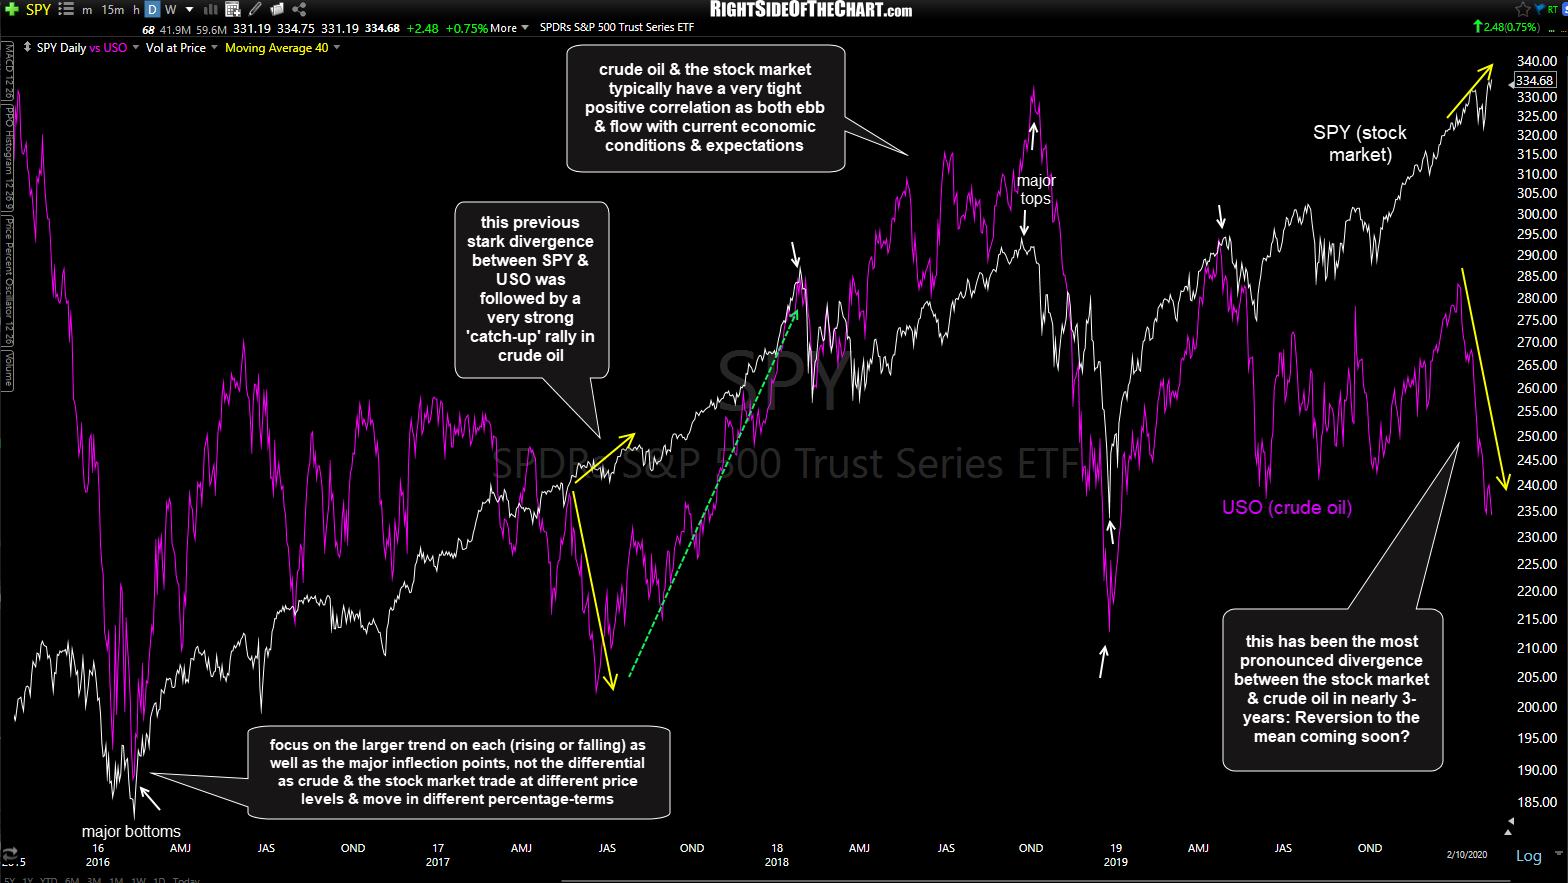
SPY vs USO Feb 11th
Two points to keep mind though: 1) Divergences between two correlated assets classes can continue for quite some time and 2) the ultimate reversion to the mean can manifest in several ways (i.e.- crude up & stocks down; both rallying with crude rallying faster as back in 2017; stocks falling & crude trading flat or falling less; etc…) With that being said, as of now, it still appears to me that a case for a significant bottom or at least a decent oversold bounce off long-term support on crude oil from at or around current levels can still be made, especially if the stock market continues to rally in the near-term.