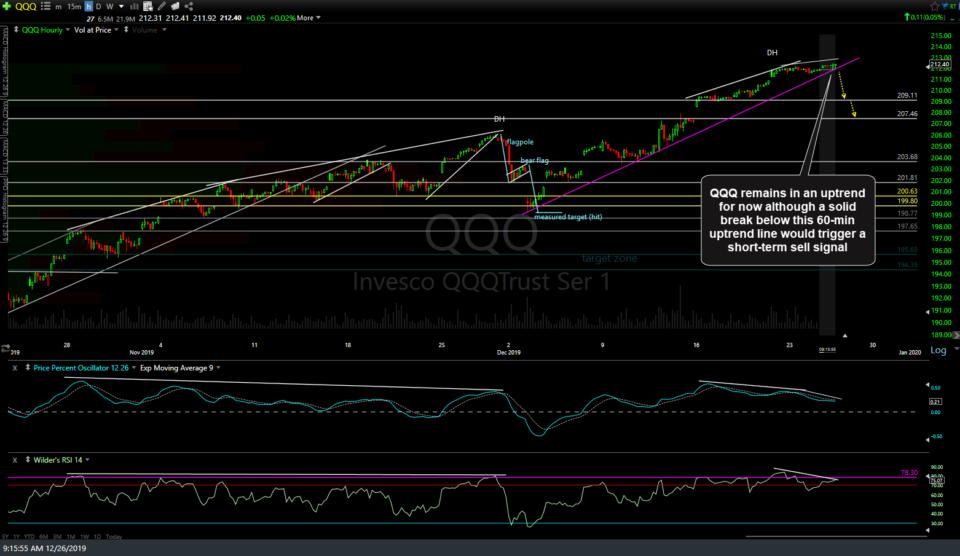
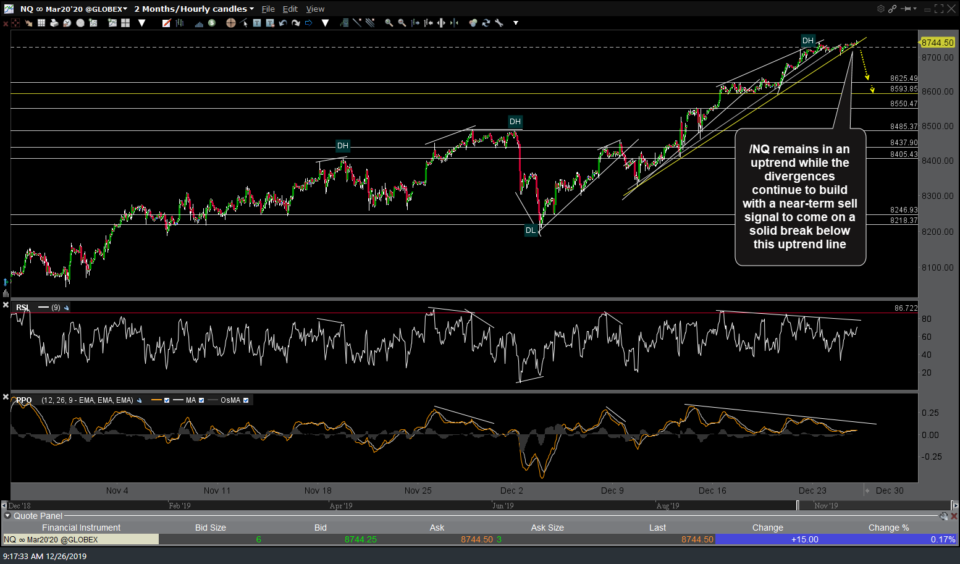
Although I’m still in holiday mode & not actively trading this week, here are a few of the charts that I’m watching starting with QQQ, which remains solidly entrenched in an uptrend for now although currently testing the uptrend line off the December 3rd low with a near-term sell signal still pending a solid break and/or 60-minute close below. Should a sell signal trigger soon, the minium pullback target would be just above the top of the Dec 16th gap around 209.11 with a backfill of that gap (207.50ish) also likely. Should QQQ & /NQ breakdown, SPY & IWM will likely follow.
- QQQ 60m Dec 26th
- NQ 60m Dec 26th
/GC gold futures have rallied impulsively since the breakout above the key 1488 resistance level although minor resistance here around 1513 could come into play before the 1529 target is hit. Previous & updated 60-minute charts below.
- GC 60m Dec 9th
- GC 60m Dec 13th
- GC 60m Dec 16th
- GC 60m Dec 24th
- GC 60m Dec 26th
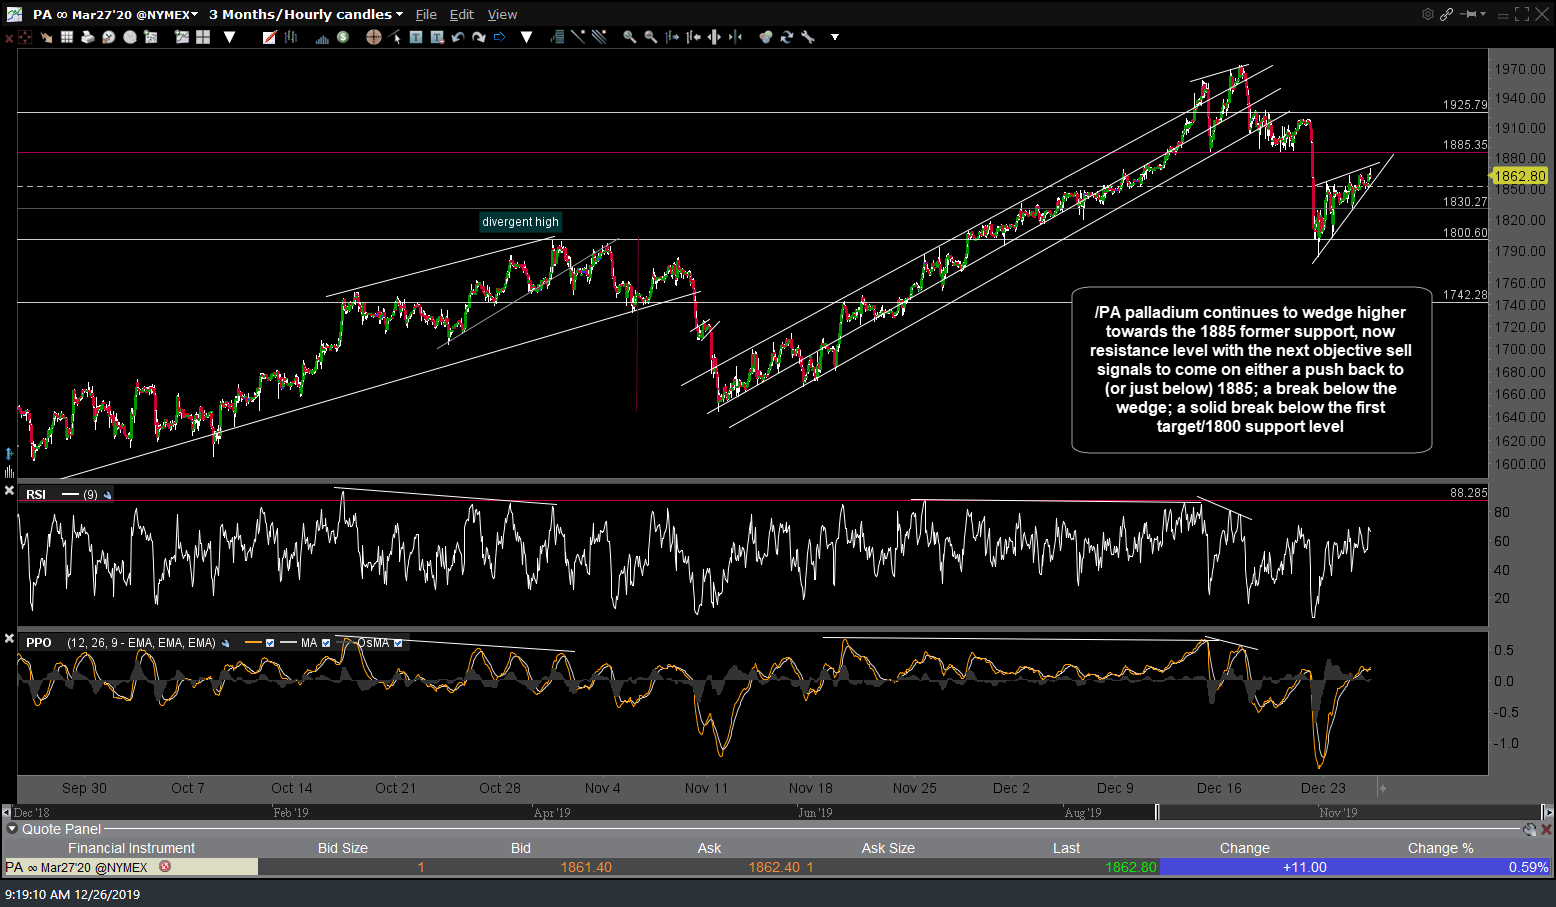
/PA palladium continues to wedge higher towards the 1885 former support, now resistance level with the next objective sell signals to come on either a push back to (or just below) 1885; a break below the wedge; a solid break below the first target/1800 support level. If we get a half-decent sell signal on the stock market around the same time /PA is offering any of those objective sell signals, PALL (palladium ETF) will likely be added as an official short swing trade idea.
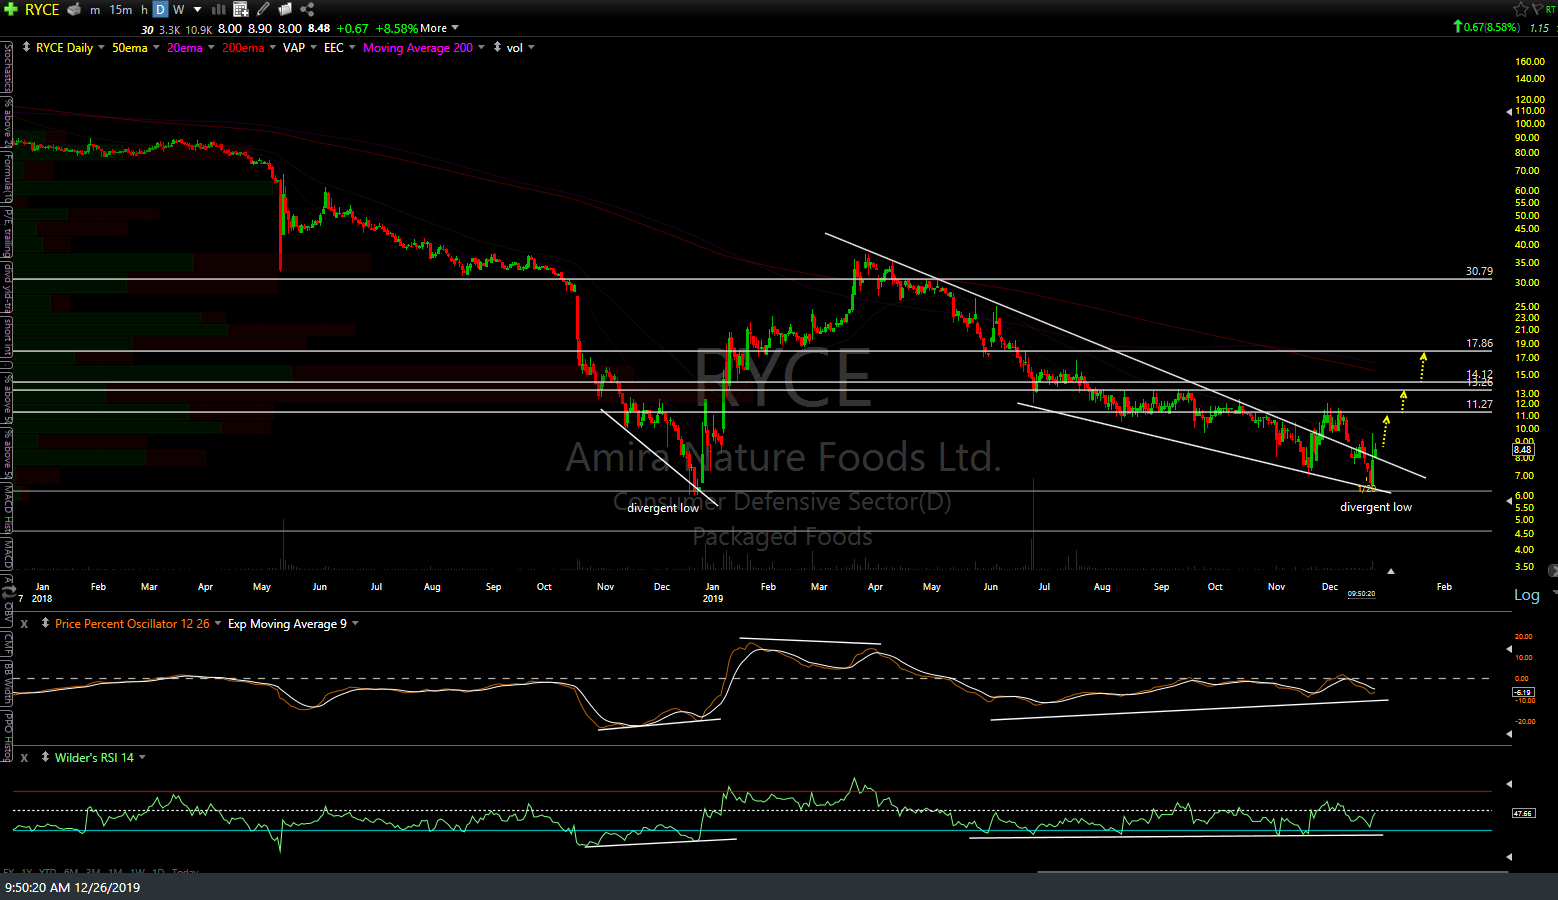
RYCE (Amira Nature Foods Ltd.) recent made a false breakout above the downtrend line off the March highs followed by a successful test of the December 2019 major reaction low & more recently, another breakout above the downtrend line with impulsive follow-thru so far today. Any or all of the overhead resistance levels marked on this daily chart are potential price targets. Just passing it along as an unofficial trade for now as I’m a bit suspect of breakouts that occur during the week of Christmas although that doesn’t mean that the breakout can’t or won’t stick.


