
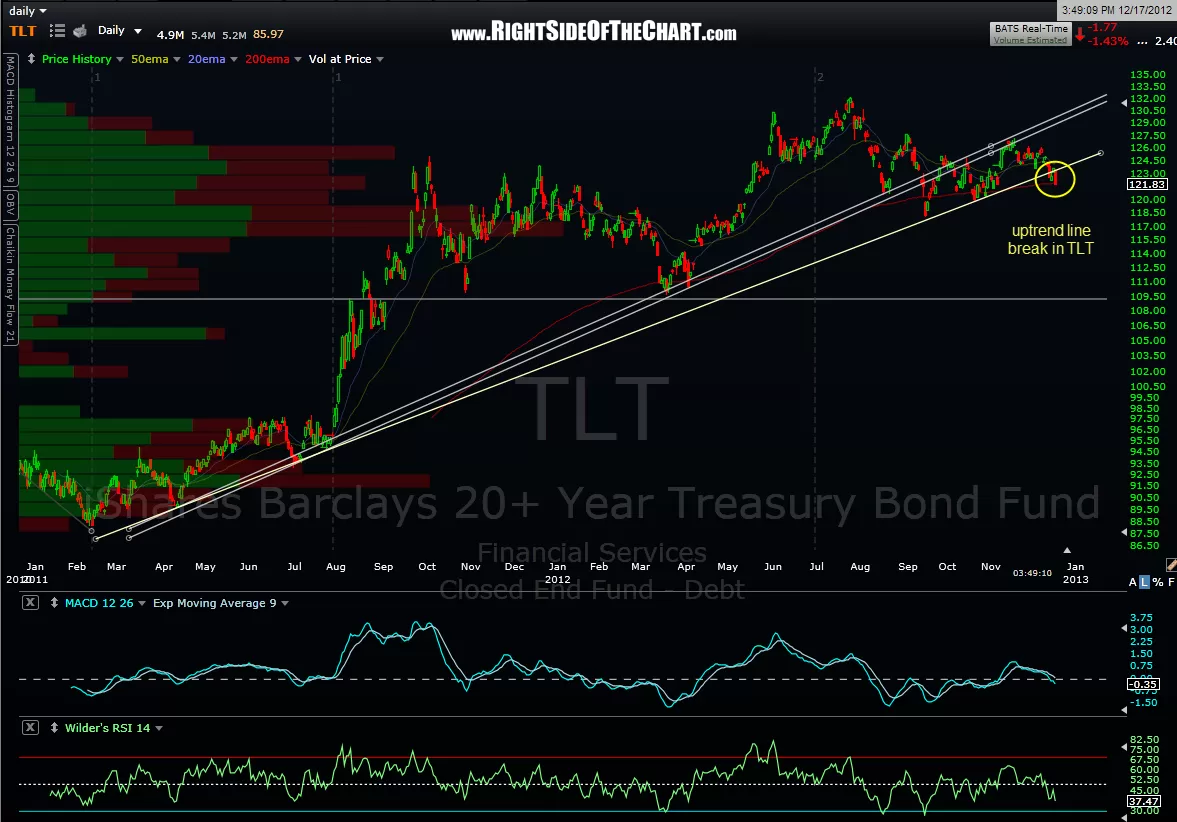
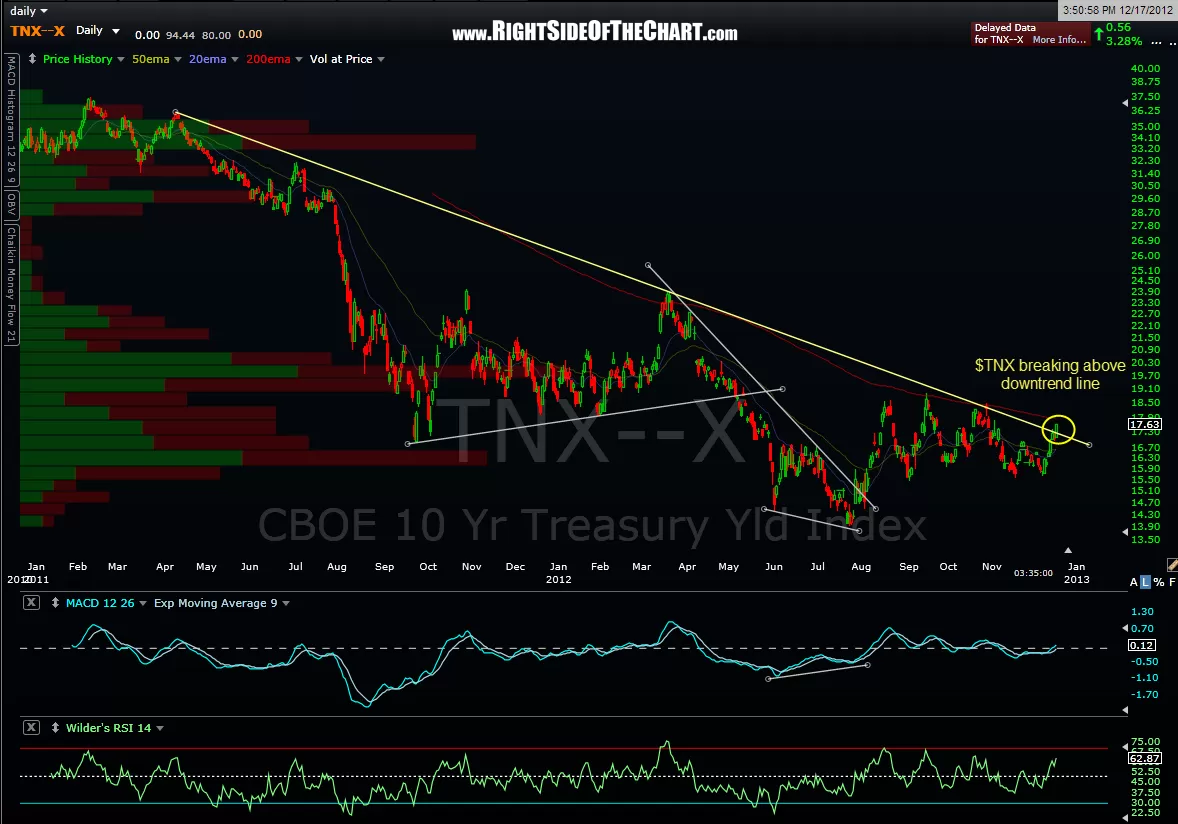
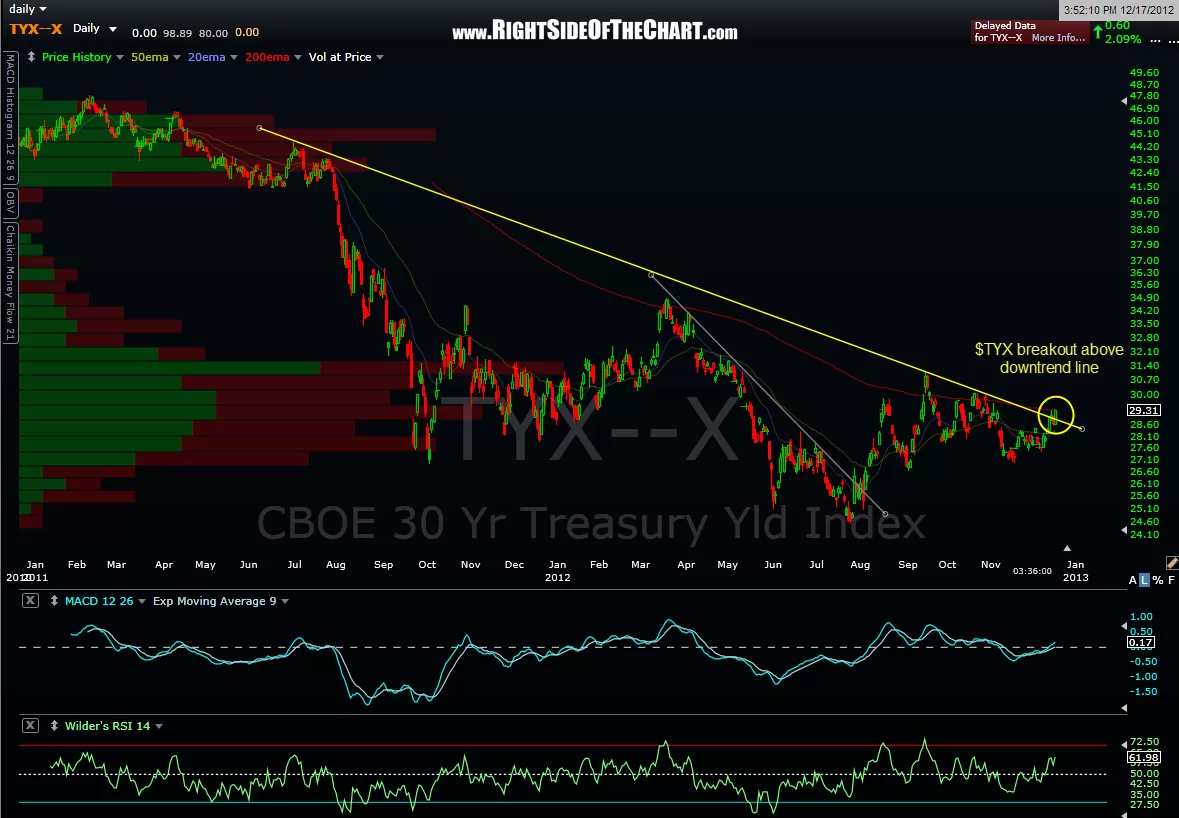
In the past I was much more active in covering the fixed income markets but with bonds the primary target of Bernanke’s printing party, I’ve felt, and still do, that many of the traditional “cues” for the stock market that have historically been derived from the bond market are of little, if any value at this time due to the extreme price manipulation of said instruments by the Fed. For the most part though, I am referring to the US Treasury market but lately I’ve been paying much more attention to the rest of the fixed income market, primarily investment grade corporates, municipals, and high-yield (aka junk) bonds and I believe most, if not all, are at or near key technical junctures at this time.Let’s do a quick run-down of the bond market in descending order of safety, starting with Treasury Bonds. These are the same charts of $TYX, $TNX and TLT posted earlier today, all of which have taken out very key trendlines today which could mark the beginning of a new trend reversal in the treasuries (rates up, prices down). Of course, of all the fixed income instruments, the Fed’s largest influence is on treasury prices/rates so personally I have very little interest in trading said instruments at this time and would not be surprised to see any technical breakout thwarted by the Fed. However, a breakout is a breakout and something to monitor as it is possible that market forces might overwhelm Ben’s printing presses.
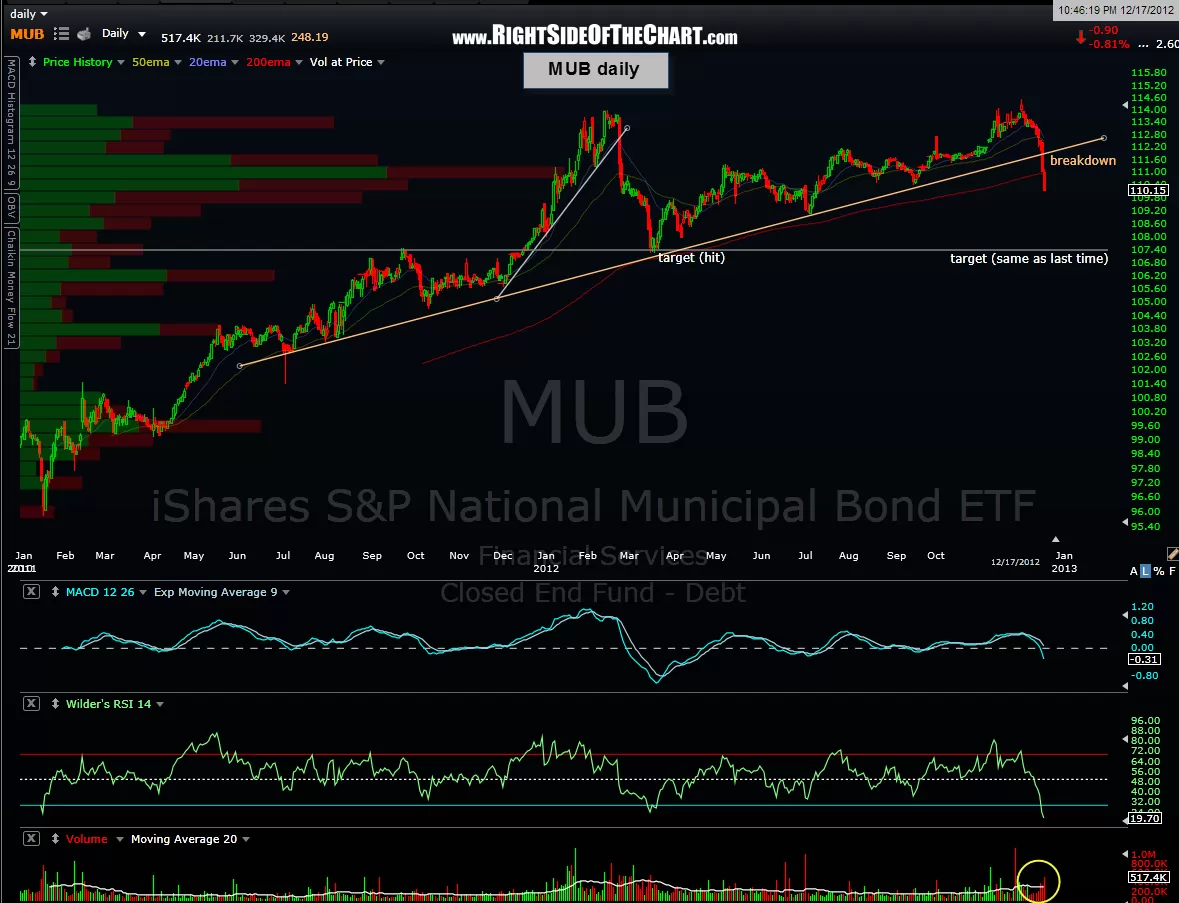
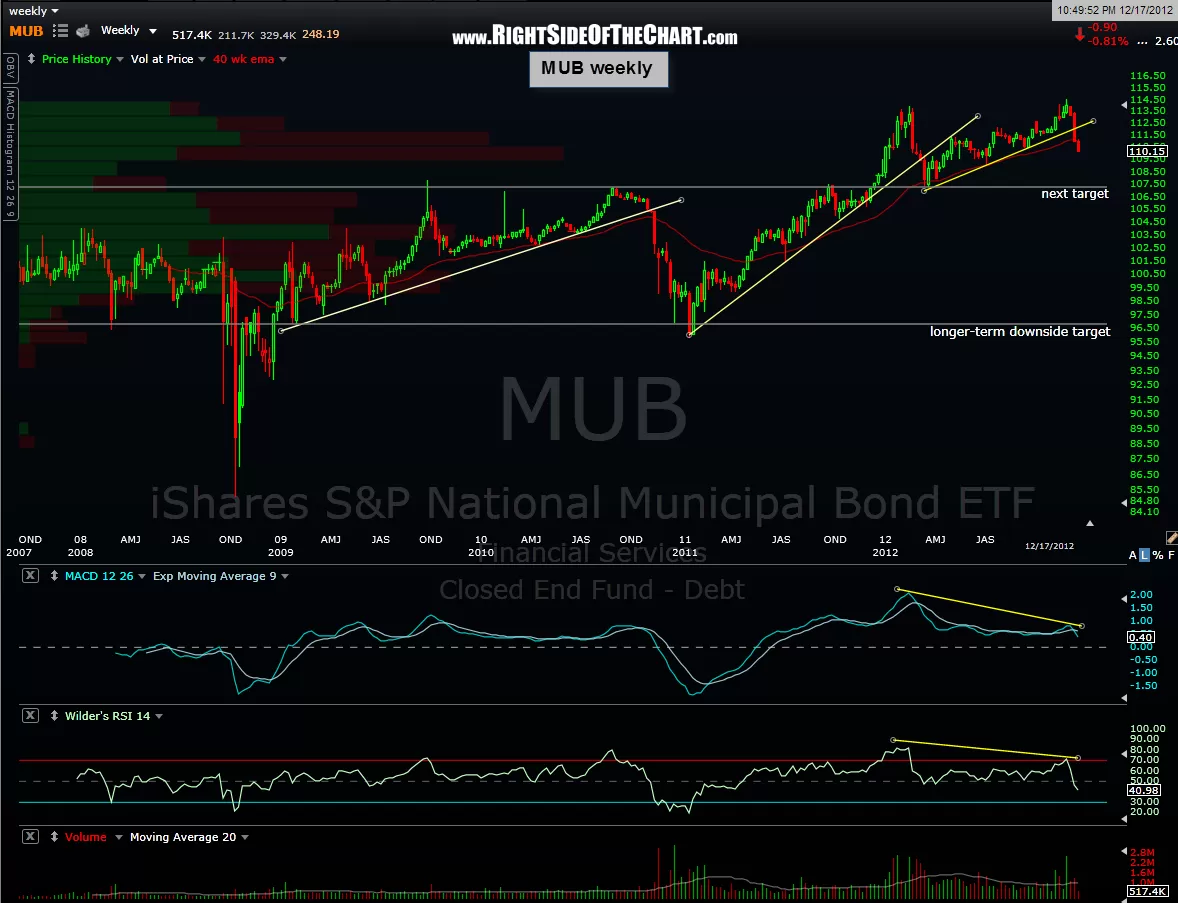
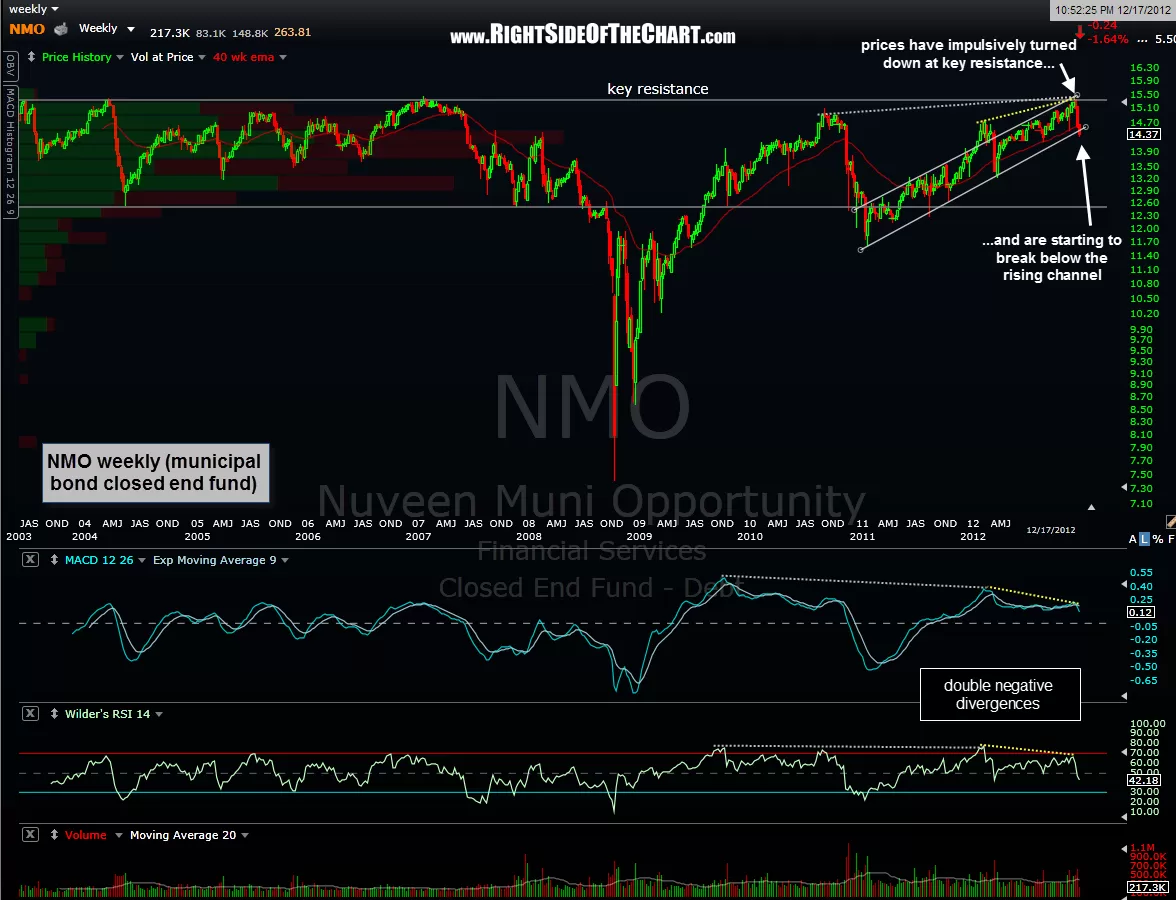
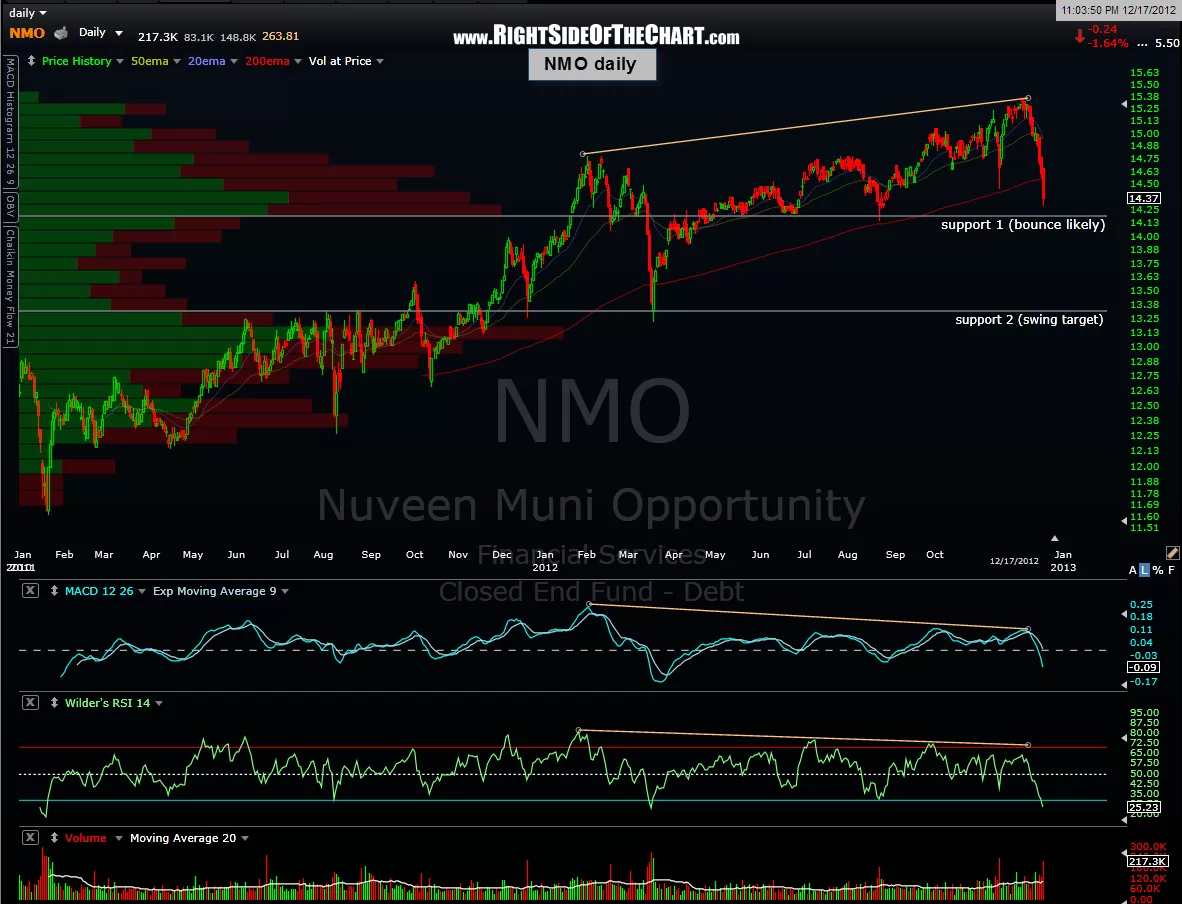
Now onto the municipal bond market, which I’ll use NMO (Nuveen Municipal Opportunities closed-end fund..similar to an ETF but selling at a slight discount to NAV currently) and MUB, the iShares S&P National Municipal Bond ETF. The charts are fully annotated but essentially this sector looks quite bearish with muni bond prices likely to move considerable lower over time (prices down = rates up). As noted, NMO is coming up on a decent support level so the odds are good for at least a small bounce before the next key support is hit.
Now onto the Corporate Investment Grade Bonds, represented below by the LQD. This daily chart shows a clear & impulsive breakdown of a well-defined uptrend line that has been in place for over a year. Also note the sharp negative divergences on the MACD & RSI that were put in on the recent all-time highs in the LQD. That tells me that corporate bond prices will most likely continue to move lower into the end of the year and/or into 2013 (and likely beyond), counter-trend bounces notwithstanding. Again, prices down = rates up.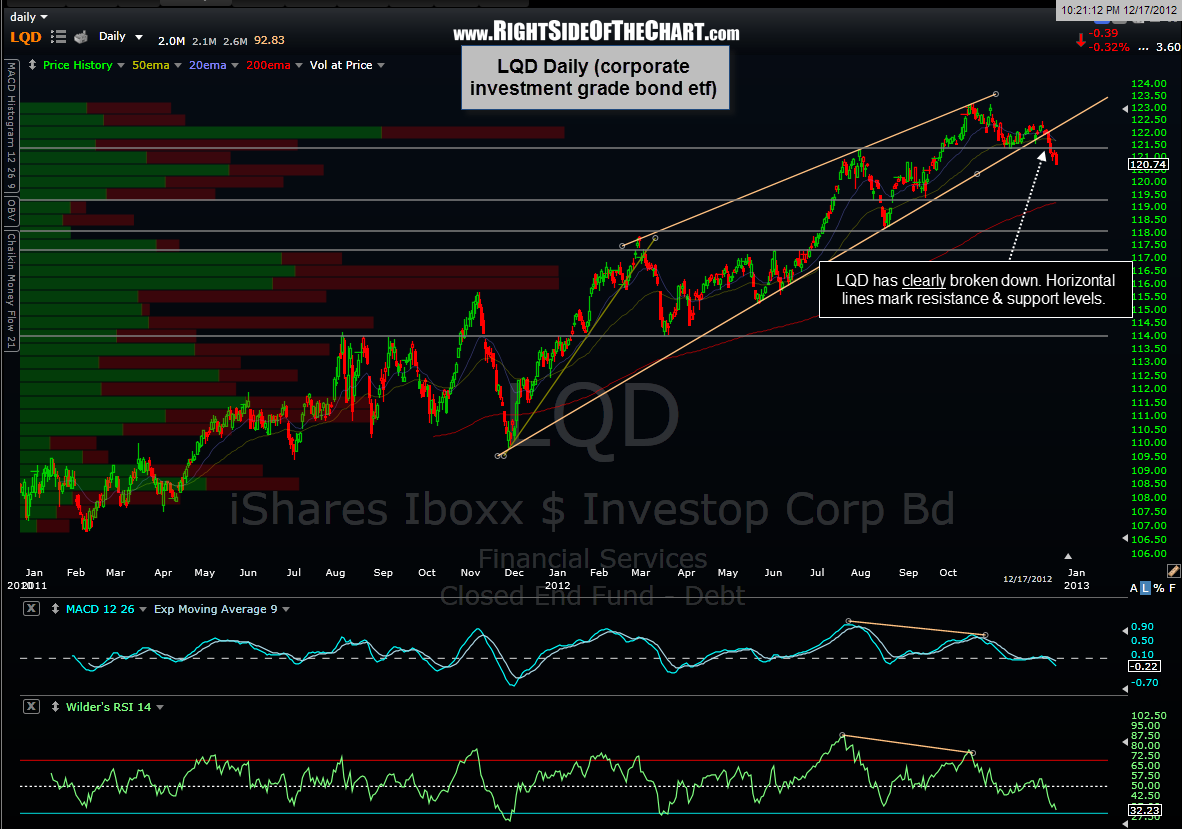 Finally, we get to what is not only one of the biggest bubbles that the Fed has inadvertently inflated, but one of the more important sectors of the financial markets to watch right now; junk bonds. Although junk bonds (aka high-yield bonds) are fixed income instruments, traditionally their performance has been much more correlated with the economy and equity prices than other fixed income instruments. This is due in large part to the fact that when the economic conditions are depressed (e.g.- a recession), defaults spike as many of these companies were in less than solid fiscal standing to begin with. Vice versa when economic conditions improve, as default rates begin to subside which is reflected in the prices of junk bonds moving higher. Junk bonds are also much less sensitive to interest rate changes as other fixed income instruments.
OK, enough of Fixed Income 101. Why is this sector important here? To begin with, take a look at the tremendous increase in volume on these two popular junk bond ETF, JNK & HYG. As we all know, the Fed has literally forced those retirees and institutions, such as pension funds, who are dependent on a steady stream of income, into alternative investments, namely high yielding stocks and bonds..both of which carry substantial risk. Just as with equities, we have what appears to be a clear, and potentially dangerous divergence between the prices and the underlying fundamentals. Like equities, with junk bonds the question is not whether we will get a reversion to the mean, but more so when the mean reversion between prices and the underlying fundamentals takes place, will it manifest in an orderly fashion, with fundamentals improving while prices gradually pull back in (both coming together) or will the disconnect continued to build until the point of recognition, whereby market participants suddenly realize that the economic is actually in a recession and prices collapse as everyone rushes for the exit in relatively short order?
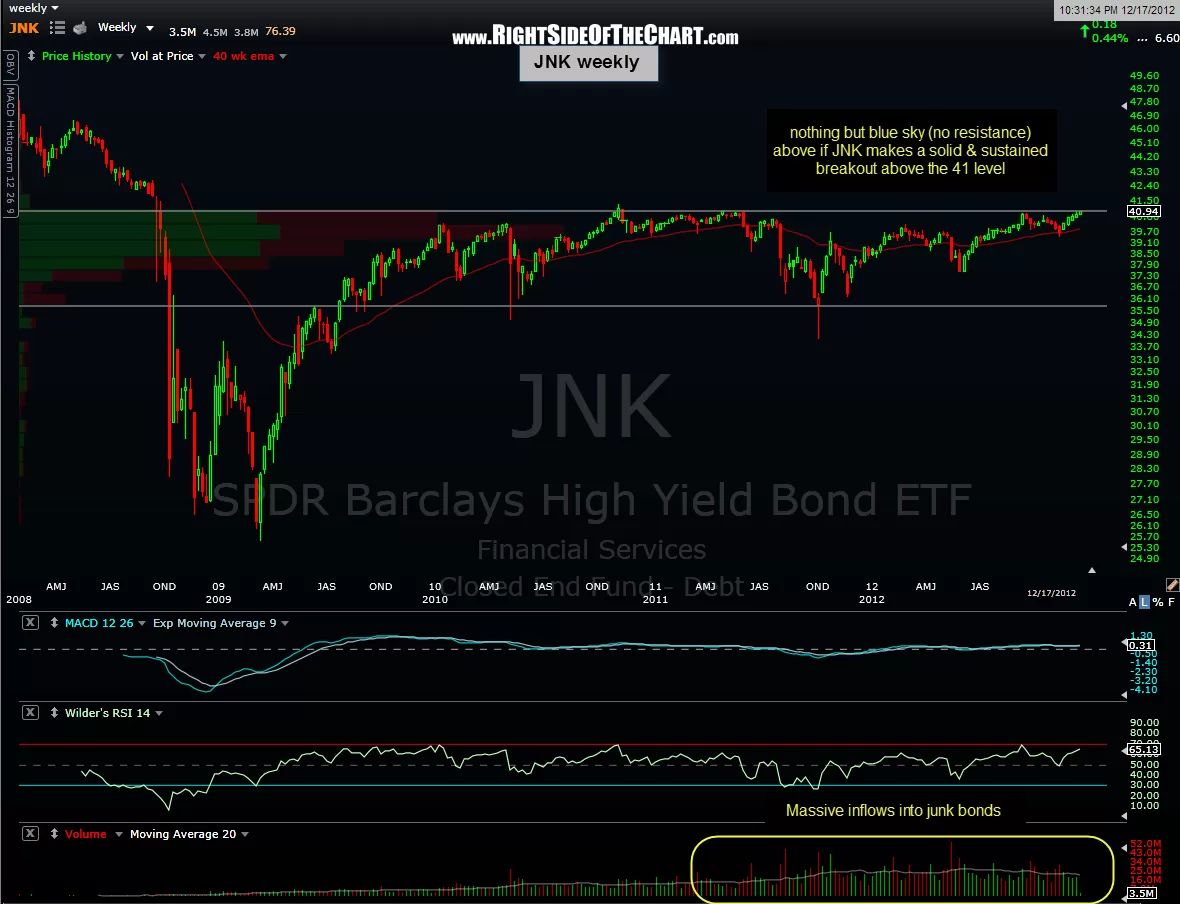
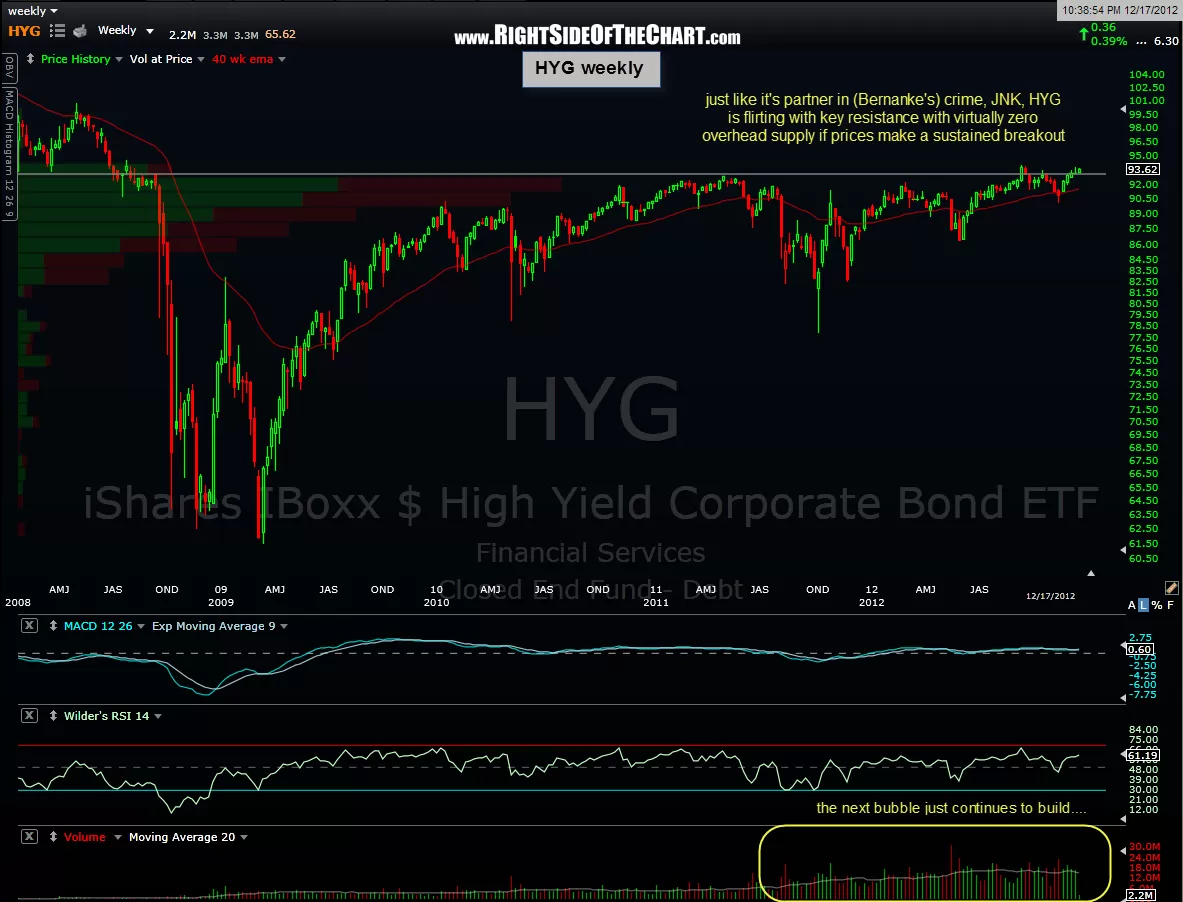
The other reason that I believe these charts merit close attention is their technical posture. Both HYG & JNK are compressed against a very critical resistance level with virtually no supply (resistance) overhead if they manage to make a clear and sustained breakout. If that were to happen, it would almost certainly mean that the stock market is moving higher along with them and most likely because the economy is improving.
To wrap this all together, putting any market biases or fundamental beliefs aside, from a pure technical perspective we have the following:
- Treasury Bonds- The breakouts today are bearish for prices, bullish for rates.
- Municipal Bonds- The recent breakdowns and current technical posture is bearish for prices (rate higher).
- Investment Grade Corporate Bonds- Bearish (prices down, rates up).
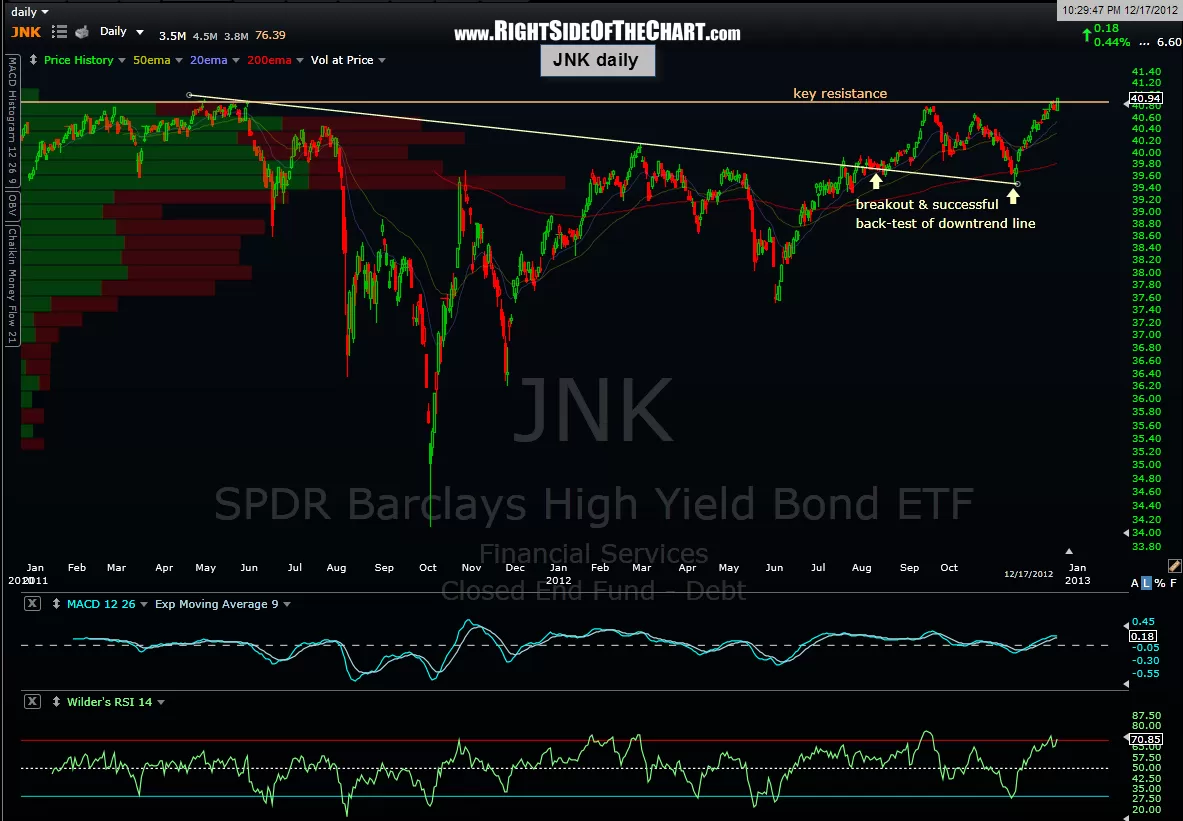
- High-Yield (Junk) bonds- Up against key resistance, a break above which would be bullish for prices (rates down) which would also most likely be reflective of a strengthening economy & stock market. However, as I often say: Resistance is resistance until broken. As such, be on the lookout for any signs of a reversal from currently levels in the high-yeild sector, such as a impulsive selling on above increased volume.
Something to consider is that is really IS different this time around. It’s different in the fact that we’ve been at a ZIRP (zero interest rate policy ) for years and even at historically low, Fed induced rates going back to the Greenspan fed days long before Bernanke completely took away literally every last one of the safe money options from investors. My fear going forward is that as rates climb, and they will sooner or later, that money will begin to flow out of junk bonds and high-yielding stocks back into safe haven assets such as treasuries, CD’s, even if/as the economy improves. Therefore, I would expect below average returns in the stock market for years to come. Fortunately, there’s always a bull (or bear) market somewhere and with the beauty of technical analysis, we’ll be able to successfully navigate whatever the markets throw our way.