
Both the Russell 2000 Small-cap Index, as well as the S&P 500 Large-cap Index, broke down below the previously highlighted bearish rising wedge patterns on the 60-minute time frames (both the futures & ETFs). While normally this would be a “hard short” sell signal, with the big FOMC rate decision scheduled for 2 pm EST today, it would be prudent to keep things relatively light at least until Powell finishes his press conference that should start around 2:30.
Nothing wrong with taking a partial short position here, as a breakdown is a breakdown, until & unless that sell signal is negated by a solid recovery back above these uptrend lines (as well as the primary downtrend lines off the mid-Aug highs). My preference is to allow wider-than-usual stops if/when holding positions going into a highly anticipated FOMC meeting in order to minimize the chances of having my stops clipped in the pre & post-FOMC volatility. 60-minute charts of SPY, /ES, IWM, & /RTY below… QQQ & /NQ charts to follow soon although the Q’s will move with the SPX.

SPY 60m Nov 2nd
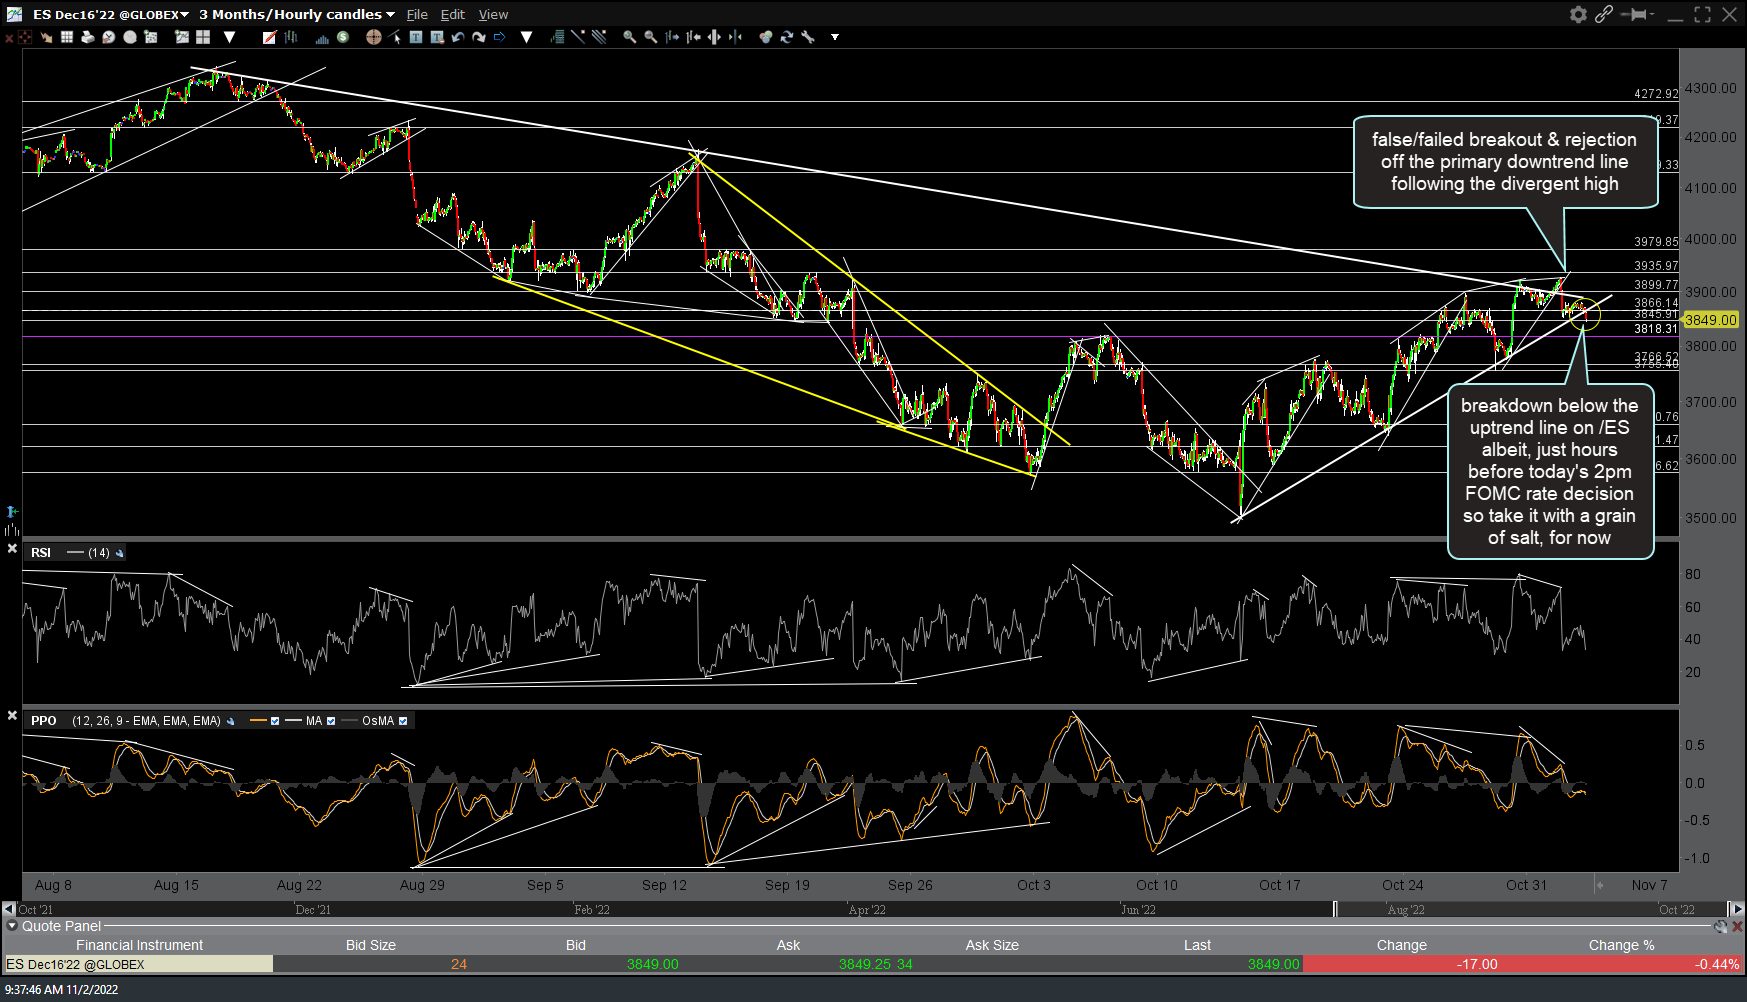
ES 60m Nov 2nd
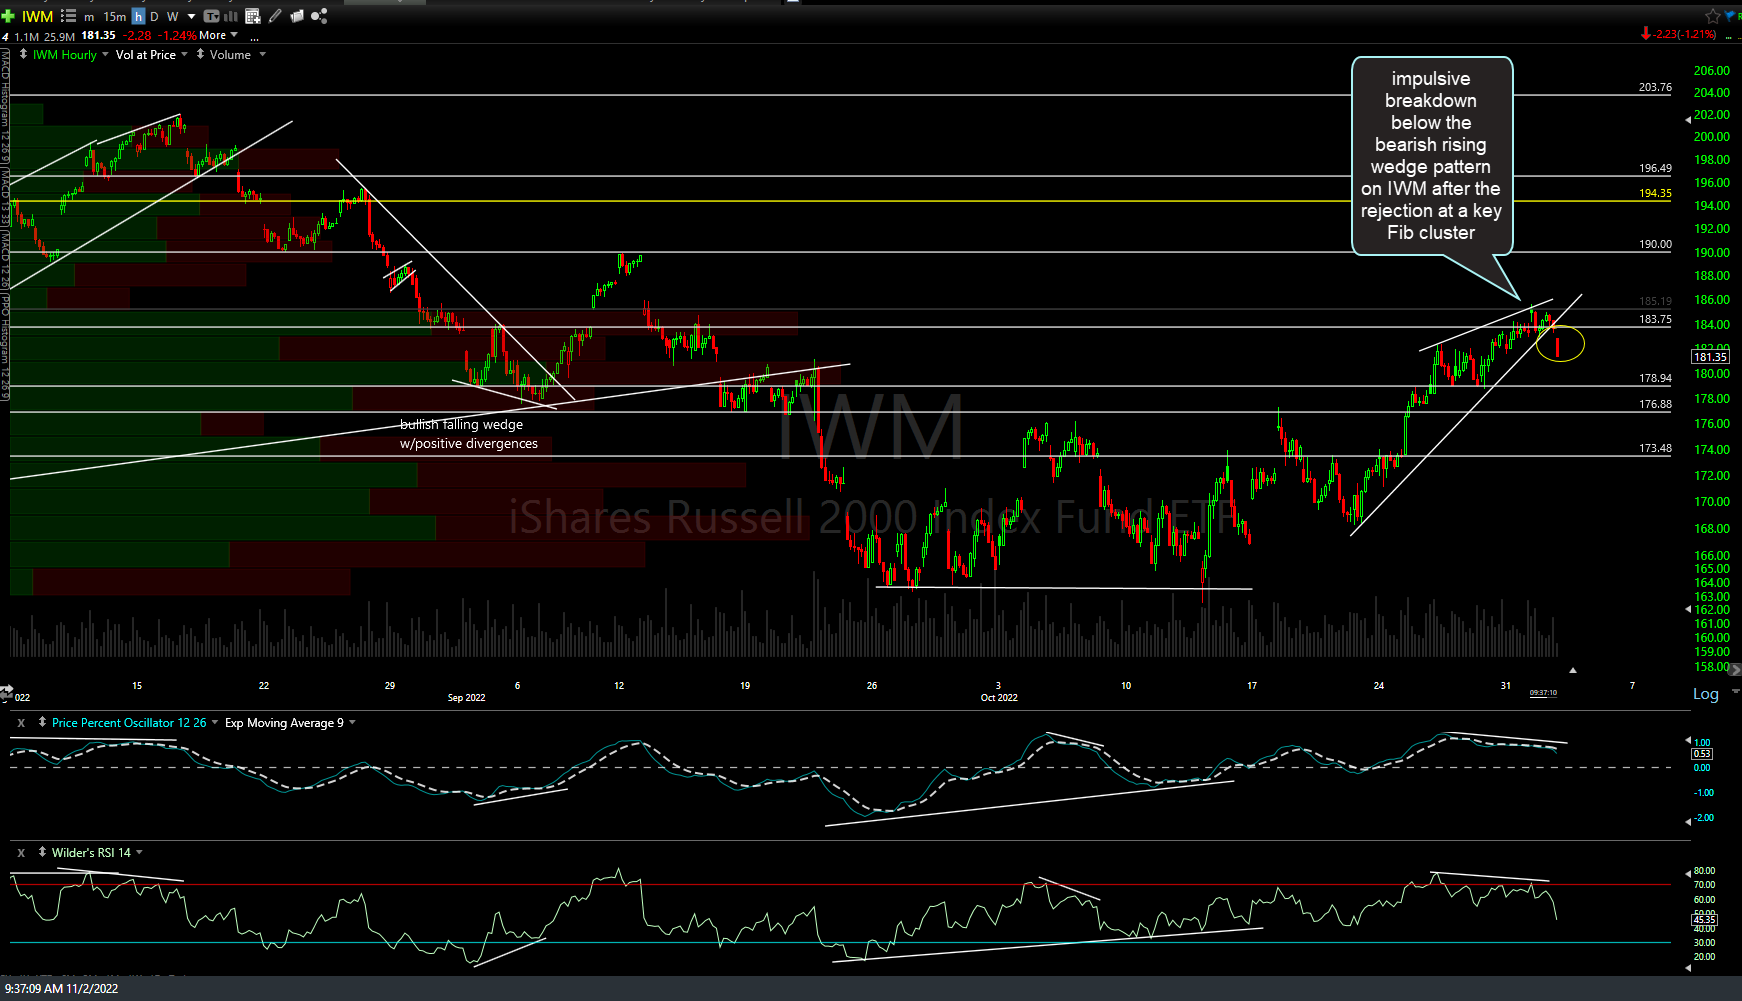
IWM 60m Nov 2nd

RTY 60m Nov 2