I don’t think a bottle of Listerine is going fix the horrible breadth that this market is suffering today, rather a swift move to the downside in the very near future is likely to do the trick. For those not familiar with the term market breadth or why it’s worth tracking, let’s take a look at breadth from both a long-term & short-term view. Market breadth is technique used in technical analysis that attempts to gauge the direction of the overall market by analyzing the number of companies advancing relative to the number declining. Essentially, when breadth is declining while the broad market is rising, it tells us that fewer and fewer stocks are responsible for the rise in the broad indices, a sign that all is not well under the hood.
-
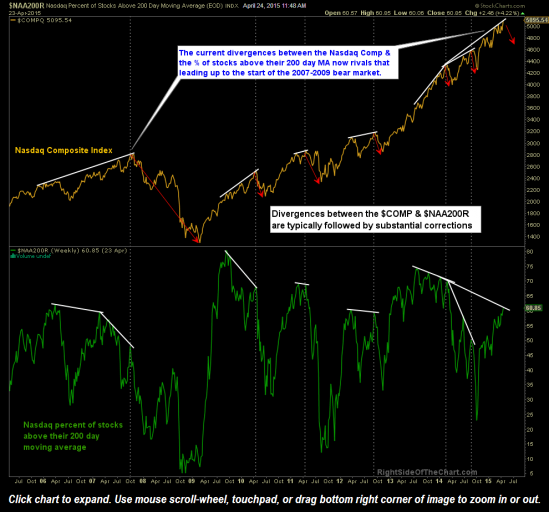
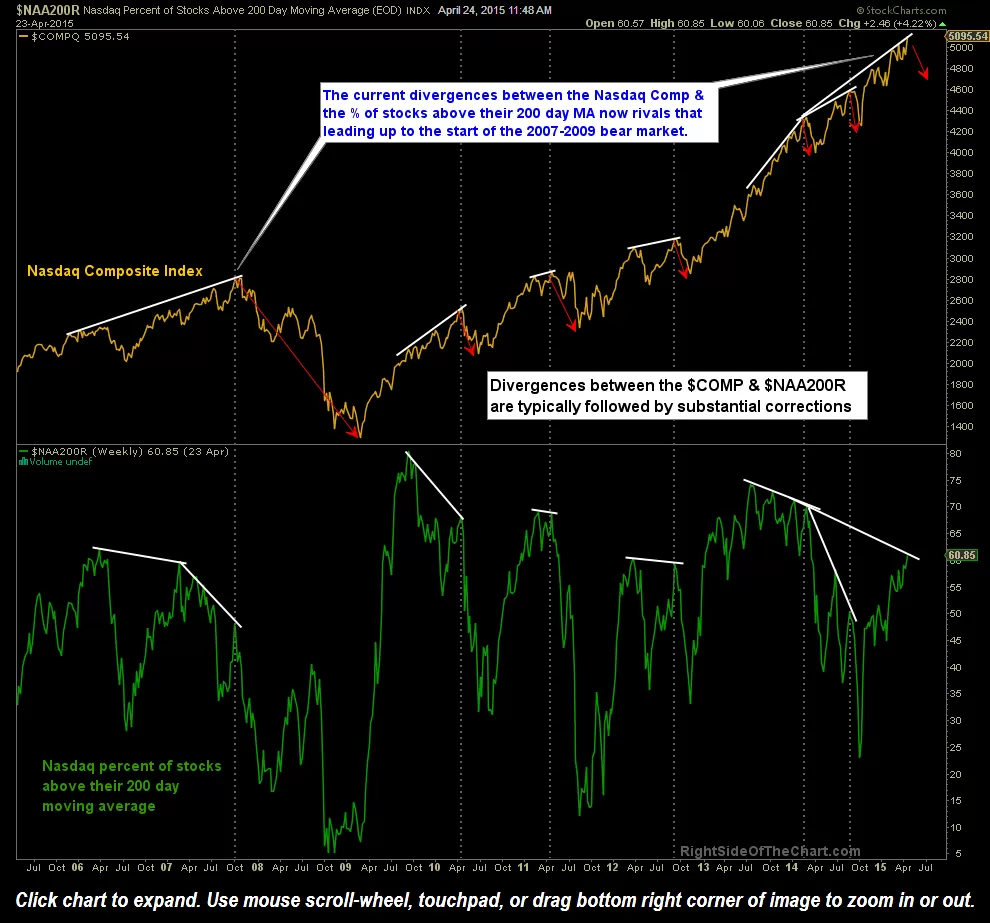
- $COMP stocks above 200 dma
-
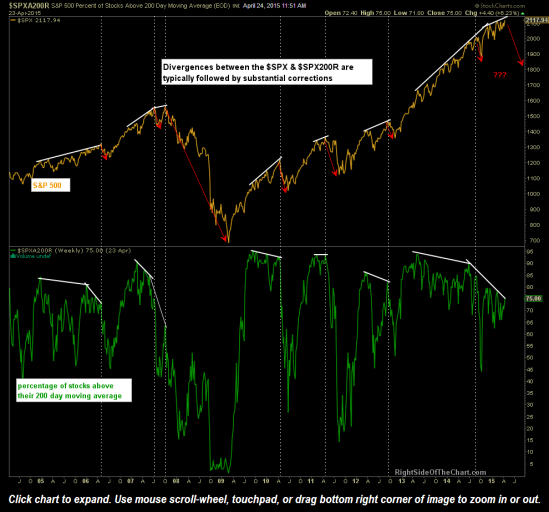
- $SPX Stocks Above 200 dma

The charts above span over a decade plotting the S&P500 index & the Nasdaq Composite Index against the percentage of stocks within each index trading above their 200-day moving average. The current divergences in place on both far exceed any previous divergences over the last decade+. While I’ve pointed out these current divergences in the past, which have only continue to build since, I have not been able to find a single instance in the past where such divergences have not lead to a substantial correction or bear market.
So with these divergences just continuing to build month after month while the market goes higher, is there any usefulness in knowing this data? Not for timing purposes such as exiting a investment portfolio or longs or aggressively shorting the market but from a longer-term perspective, it only stands to reason that the longer & more powerful (i.e.- the differences between the slopes of the two lines), the more likely the ensuing correction or bear market will be once these divergences finally manifest in the form of a new downtrend.
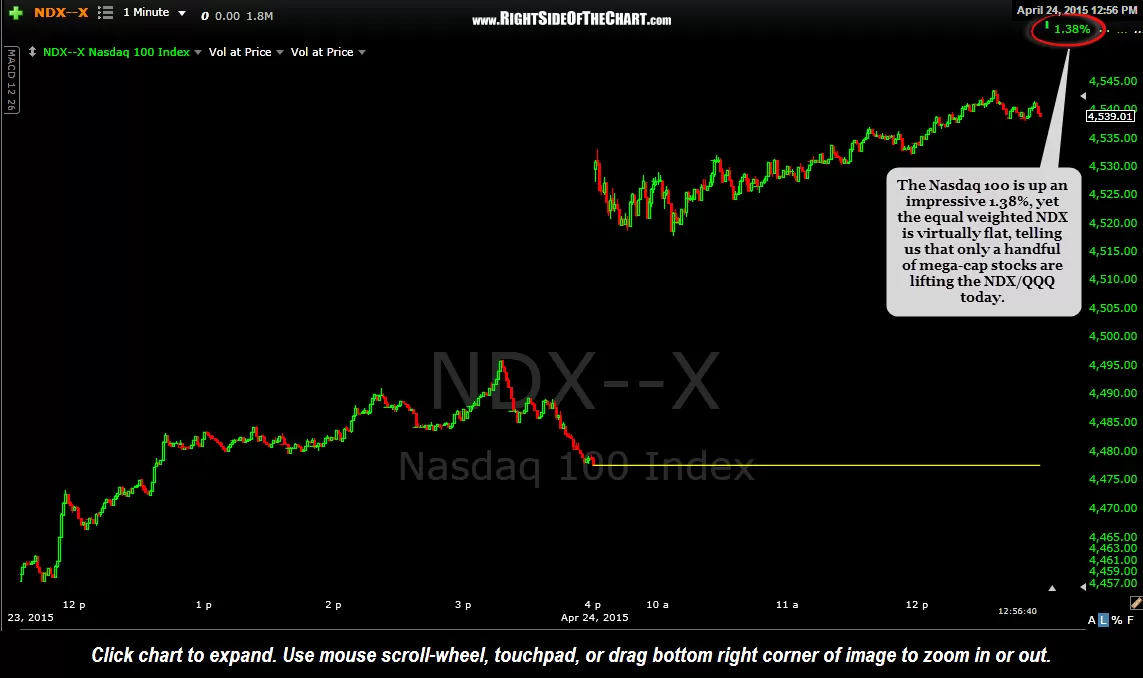
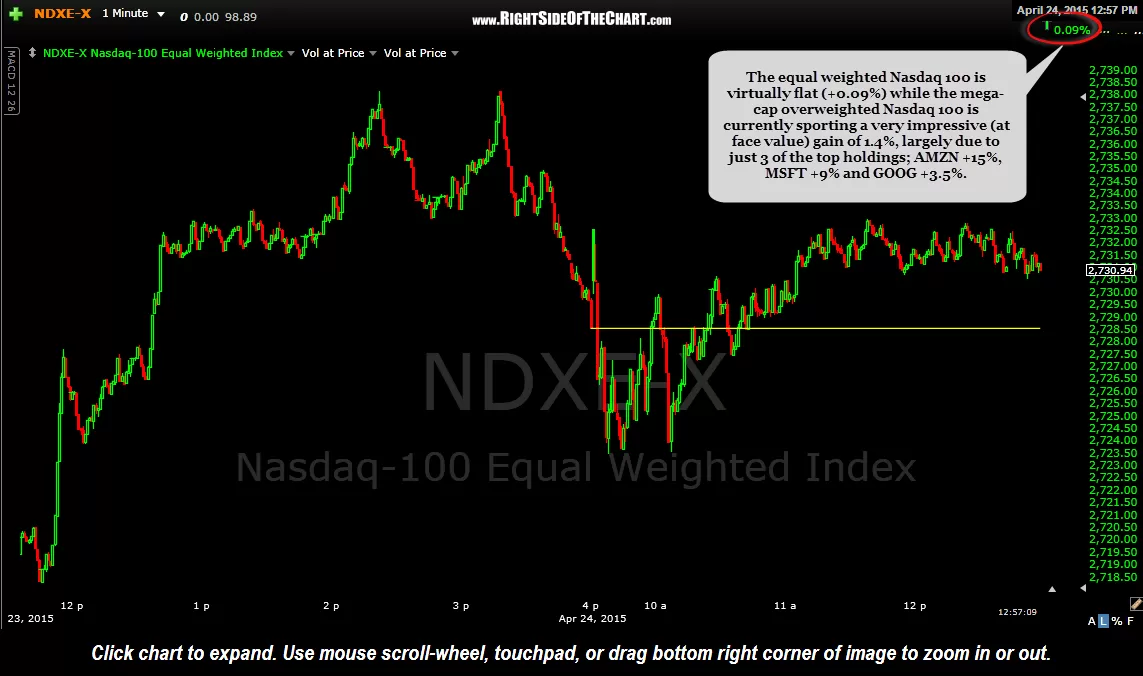
Now let’s zoom into a much shorter time frame. The other day I had pointed out how the equal weighted Nasdaq 100 index was under-performing the regular Nasdaq 100, which is extremely overweight with its ten largest components, AAPL being the largest weighting. In fact, the top 10 components of the 107 securities in the $NDX make up a whopping 47.75% weighting in the index. In other words, only 10 stocks account for nearly 50% of the performance of that index.
As the charts below show, despite today’s impressive 1.4% gain in the $NDX, almost all of those gains are attributed to just 3 of the top 10 components: AMZN (+15%), MSFT (+9%), and GOOG (+3.5%). Essentially, the majority of the remaining 104 stocks in the $NDX are sucking wind today as the Equal-weighted $NDX has traded virtually flat all day… not a sign of a healthy advance.
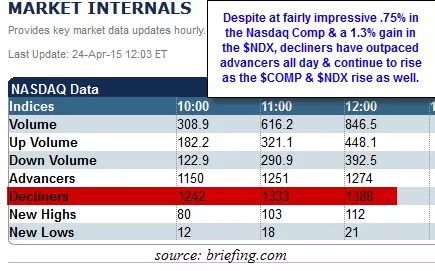
This is further evidenced by today’s market internals. Despite at still impressive .75% in the Nasdaq Composite, decliners have outpaced advancers all day & continue to rise since the open, even as the $COMP & $NDX rise as well (telling us that the bulk of stocks in the Nasdaq opened negative today and more & more stocks have turned negative throughout the day so far, despite the $NDX & $COMP moving higher).
-
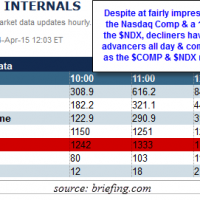
- Deteriorating Market Breadth
-
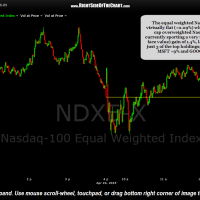
- NDX Equal Weighted Index
-
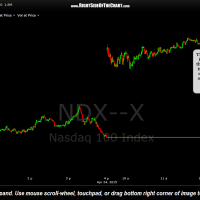
- NDX Index 1-minute chart