
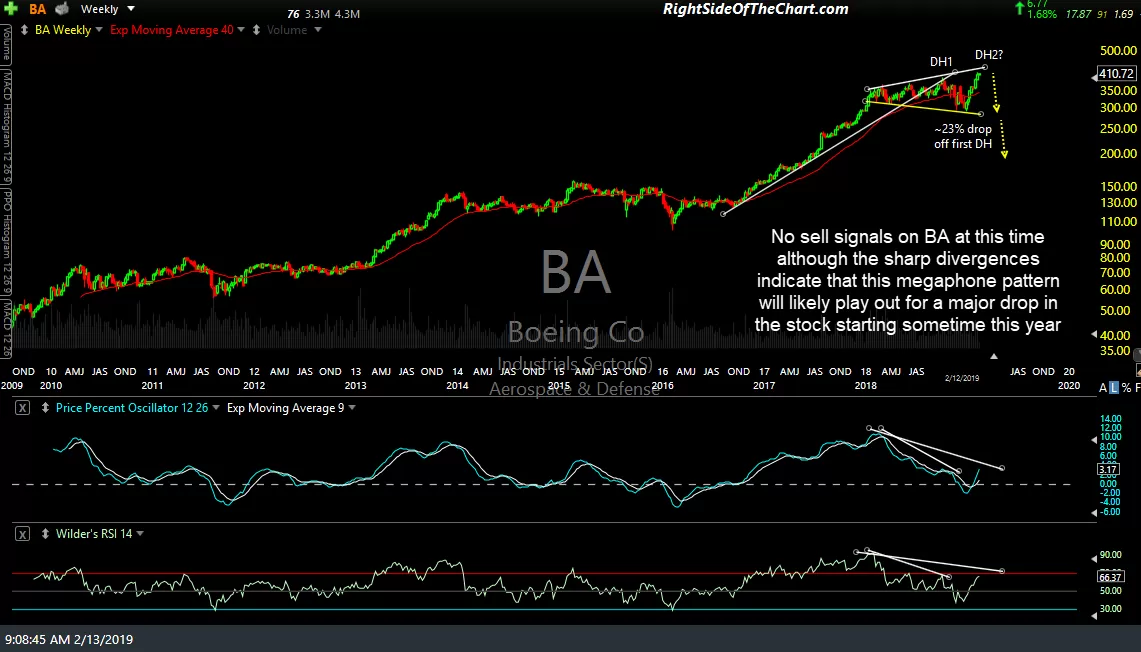
Long before the first of the 737 Max issues began, BA (Boeing Co.) was highlighted back in mid-February 2019 as setting up in a bearish megaphone topping pattern on the weekly charts while stating: “No sell signals on BA at this time although the sharp divergences indicate that this megaphone pattern will likely play out for a major drop in the stock starting sometime this year”. (see first chart below, weekly chart followed by the previous weeklies).
-
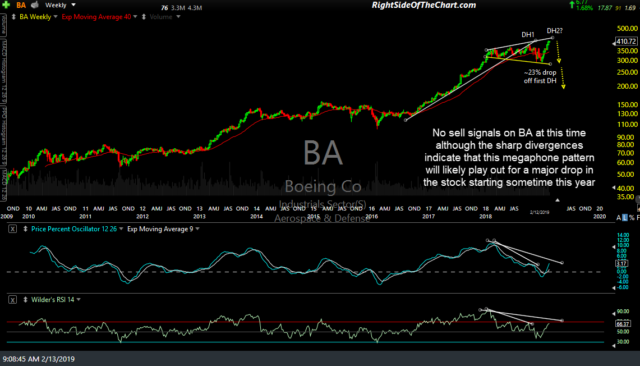
- BA weekly Feb 13th
-
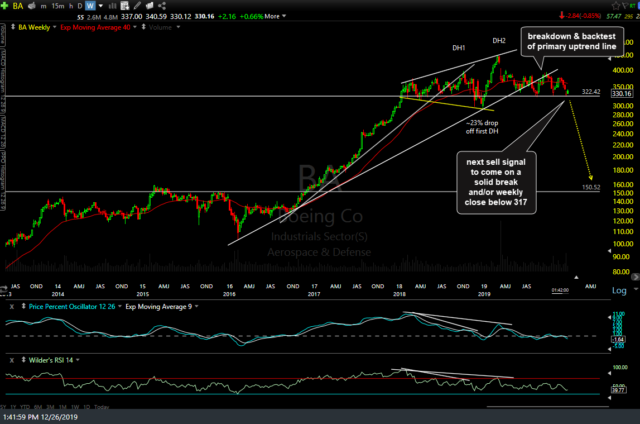
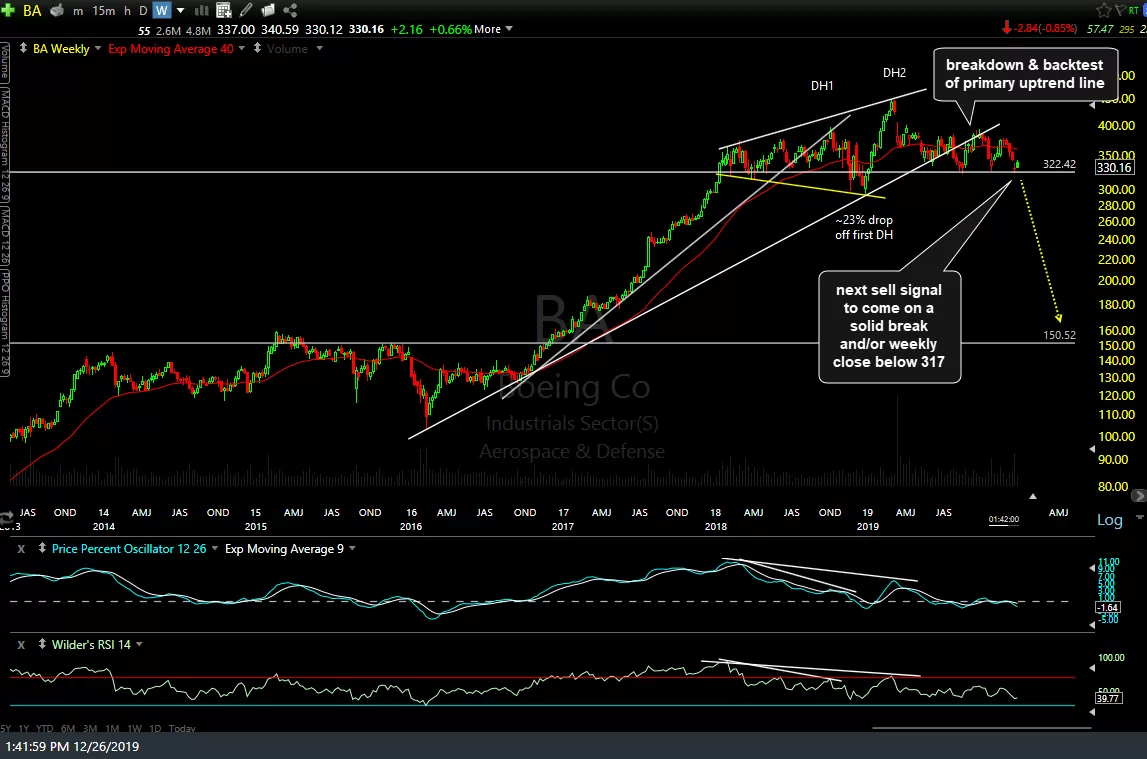
- BA weekly Dec 26th
-
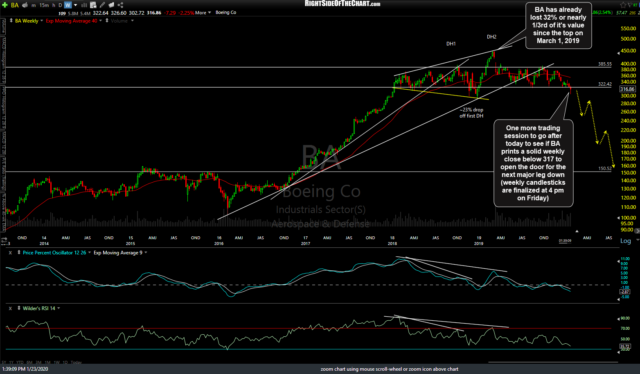
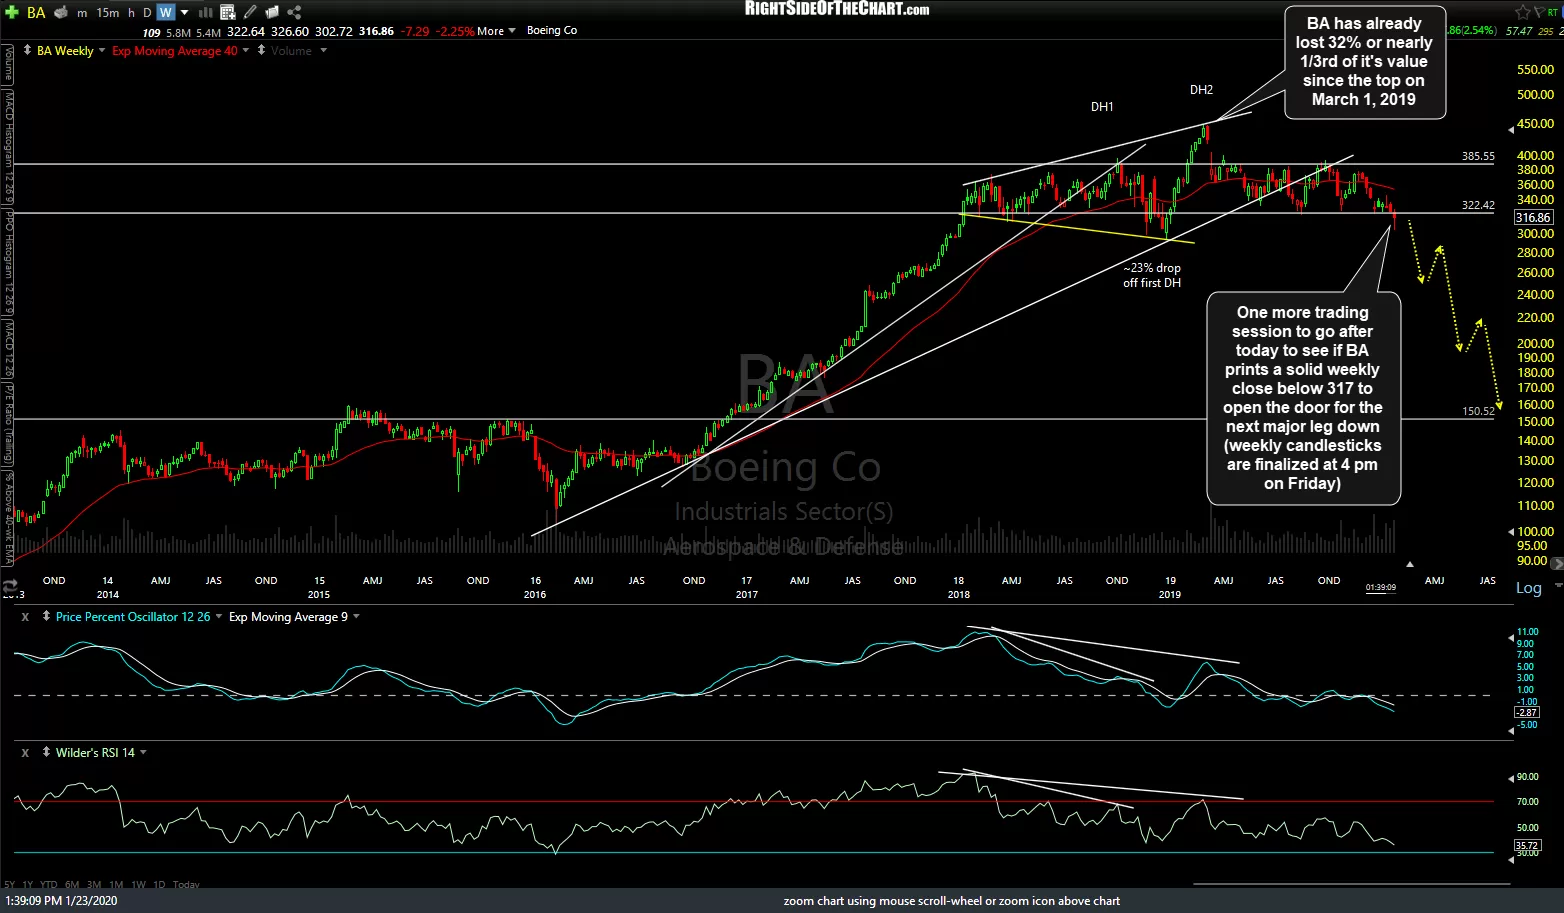
- BA weekly Jan 23rd
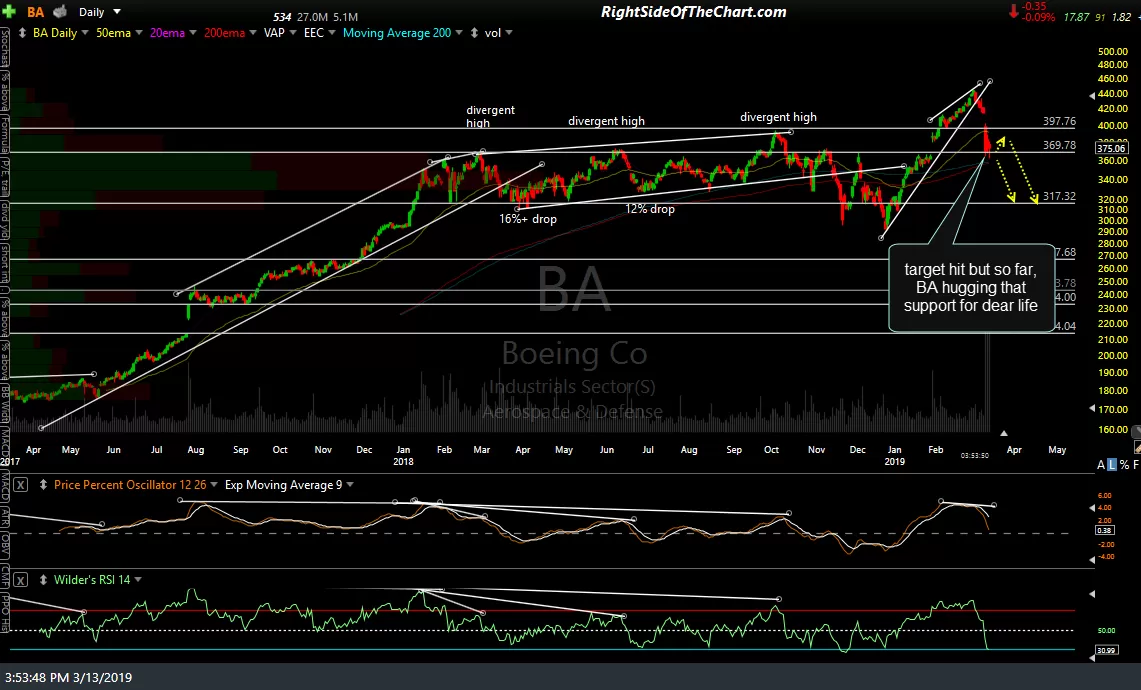
Just a couple of weeks later, BA went on to trigger that sell signal with an impulsive breakdown below a bearish rising wedge pattern on the daily chart that was highlighted at the time. (The first daily chart below, followed by the previous dailies).
-

- BA daily March 13th
-
- BA daily Dec 26th
-
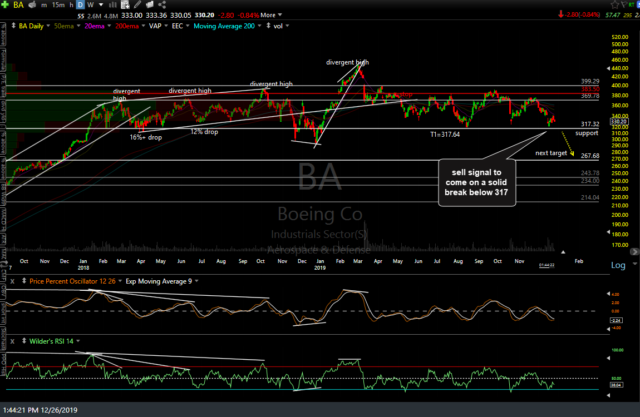
- BA daily Jan 23rd
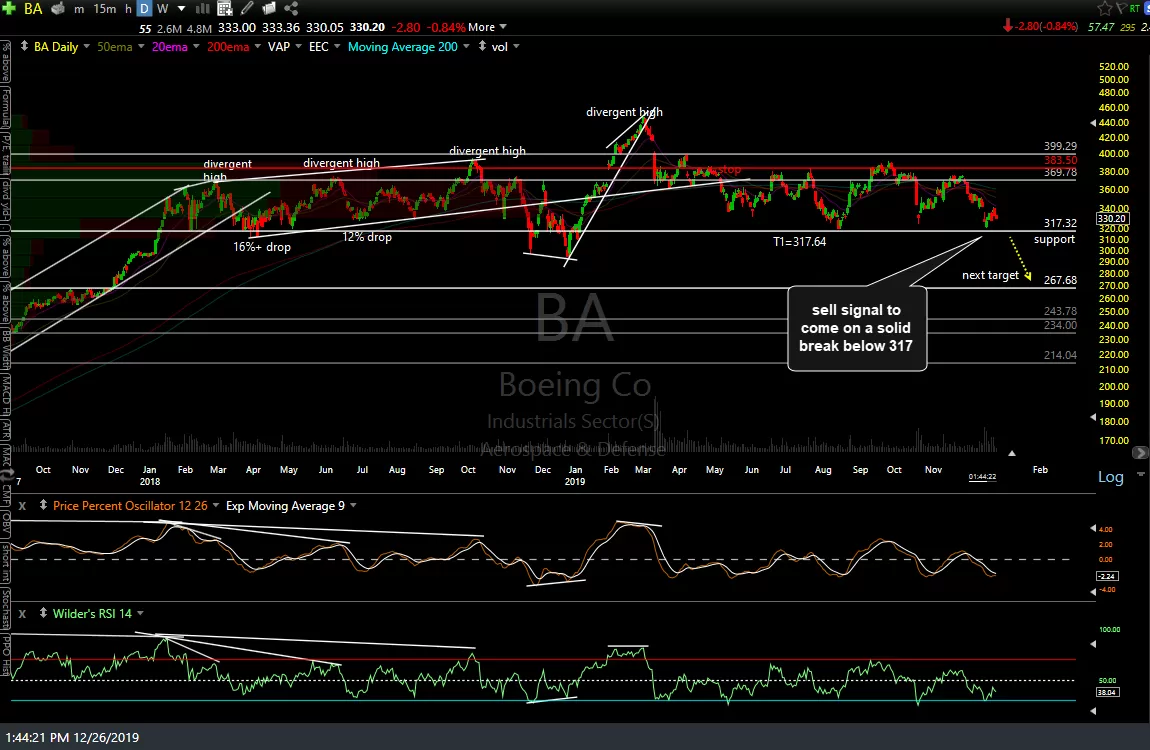
Since the March 1st, 2019 top on BA, which was clearly identified in advance via the technicals (charts), another good example of how the news often follows the technicals, Boeing has lost over 32% or about 1/3rd of its value. I’ve decided to post an update on Boeing as it meshes with my recent theme of how the technical posture of a stock heading into the company’s quarterly earnings report will often dictate, or at least help to provide some clues, as to which way the stock will head (higher or lower) following earnings. BA is scheduled to report on Wednesday, January 29th, before the market opens. So where does the stock go from here?
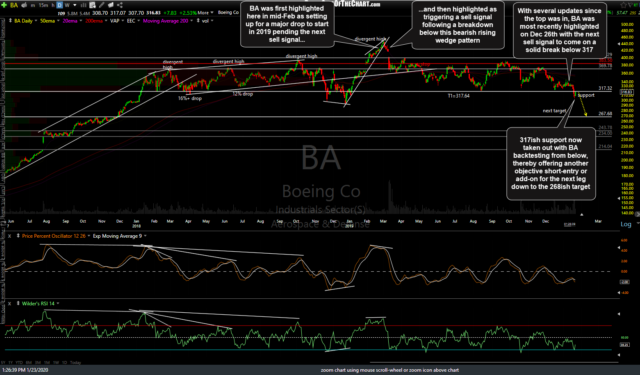
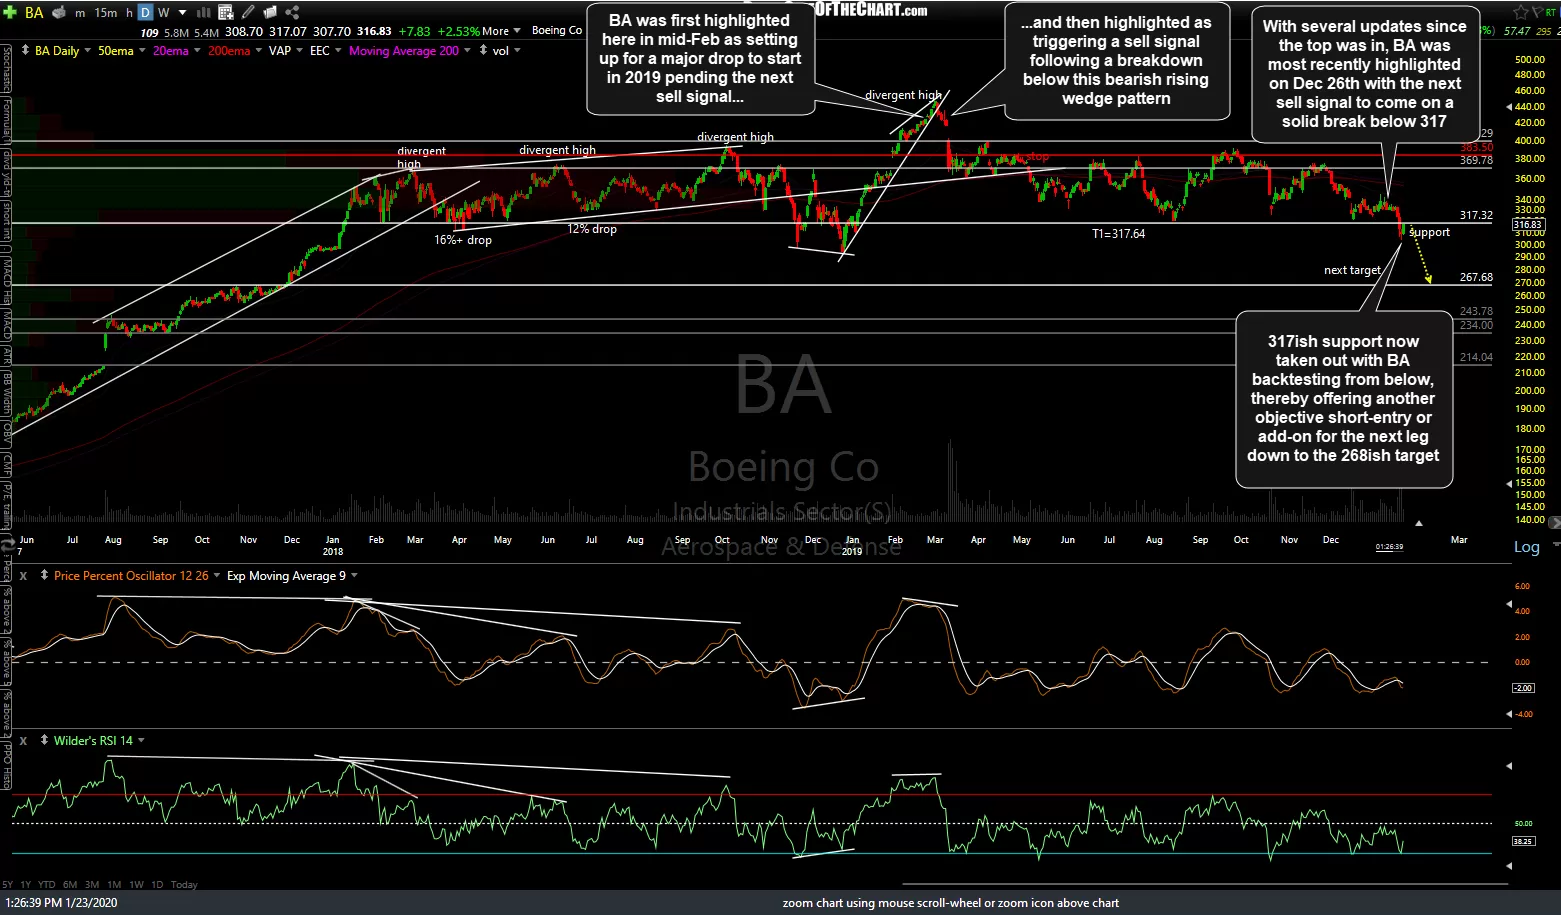
In my previous update on posted on Decemeber 26th, I had stated that “I still favor a downside break with a sell signal to come on a solid break and/or close below 317 with the next swing target just above the 267.68 support level.” From there, BA did go on to break down below 317, doing so with an impulsive red candlestick on Wednesday with the stock currently backtesting that former support, now resistance level from below on today’s snapback rally.
While this bounce back to the 317ish resistance level does offer an objective short entry or add-on to an existing long-term trend short trade, it would be even better to see a solid weekly close (red weekly candlestick) below that level. I would also be remiss not to point out that shorting (or going long, for that matter) a stock shortly before earnings is a fairly aggressive strategy as you run the risk of being caught on the wrong side of an earnings-induced gap.
Essentially, should BA rally from here to regain & close comfortable above the 317ish level before they report in less than a week from today, that would have put the stock back above support following a failed/false breakdown which would be a near-term bullish technical event. Should the stock get rejected off the backtest of the 317ish resistance & move considerable lower before earnings, that would keep the stock in a bearish technical (near-term) posture & increase the chances of a post-earnings sell-off. Also, keep in mind that whipsaw signals (false breakouts/breakdowns) tend to be more common on stocks in the week or so leading up to earnings.
As such, the “safe play” is to wait for BA to report & see how the stock trades following earnings before deciding to take a position; short if the stock is below 317 or possibly long for a swing trade to a game a rally if 317 is recovered & successful defending. The potential downside to waiting until after earnings are out of the way before taking a position is the chance that the stock might make a large earnings-induced gap up or down that doesn’t provide an objective entry if the gap is too large. Regardless of the near-term direction in the stock (next several weeks+), the longer-term outlook remains bearish at this time.