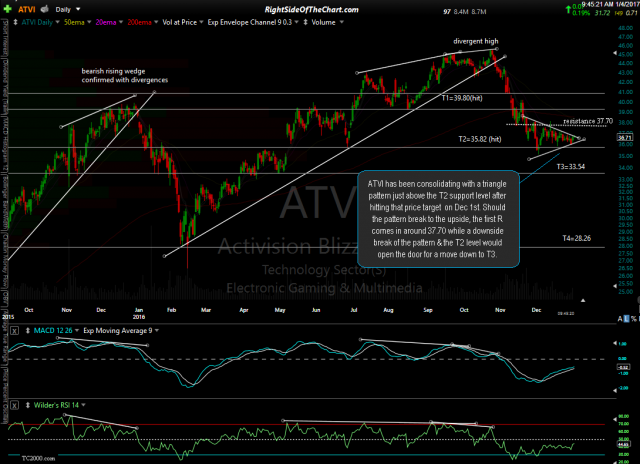
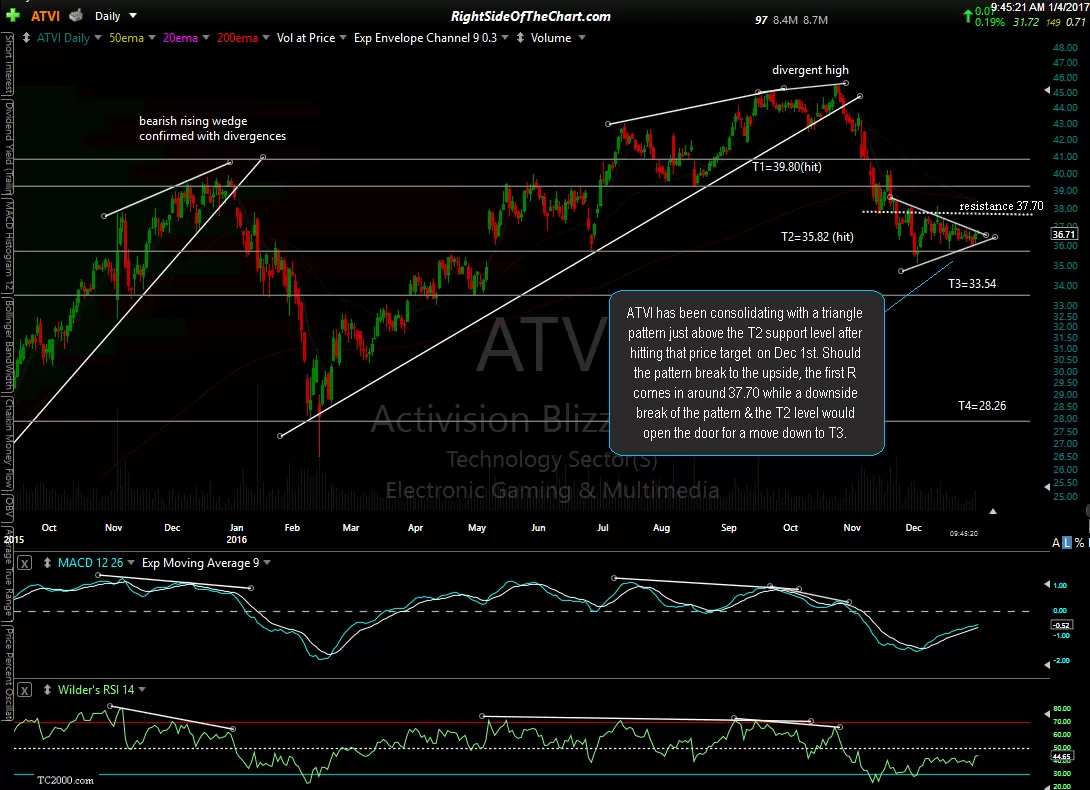
Member @retireat60 requested an update on the ATVI (Activision Blizzard) Active Short Trade. ATVI has been consolidating within a triangle pattern just above the T2 support level after hitting that second price target on Dec 1st. Should the pattern break to the upside, the first resistance comes in around 37.70 while a downside break of the pattern & the T2 level would open the door for a move down to T3. Previous & updated daily charts:
-

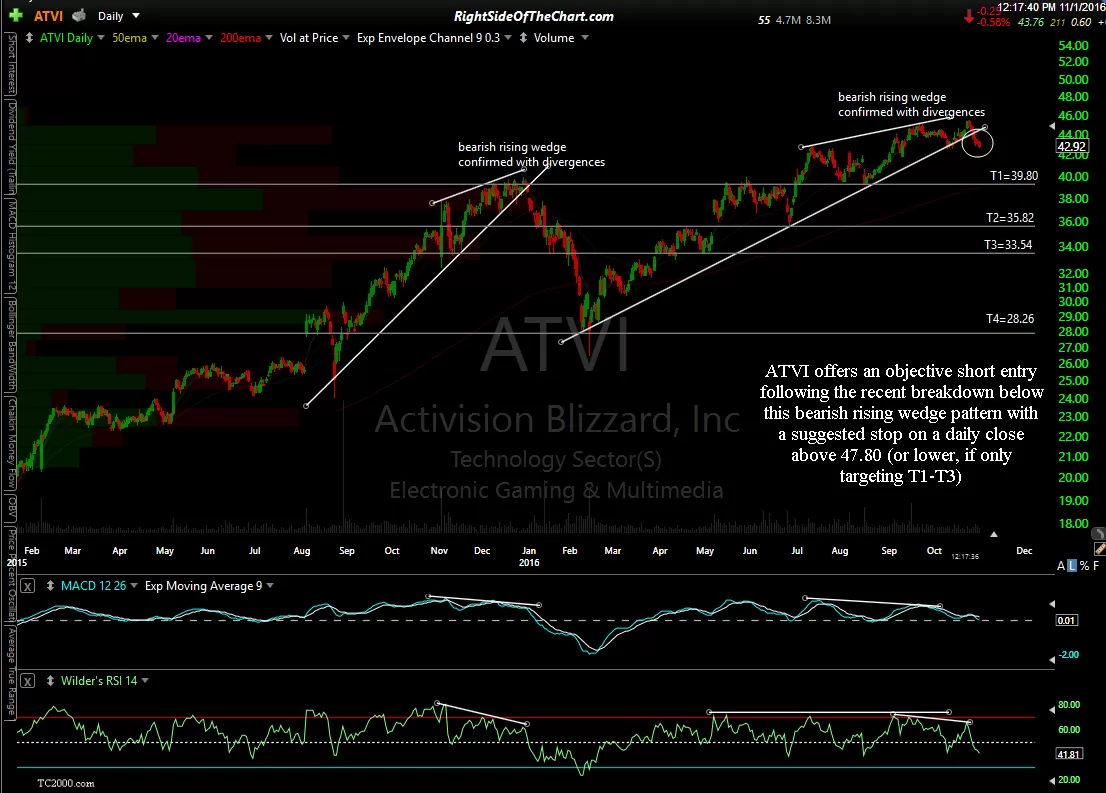
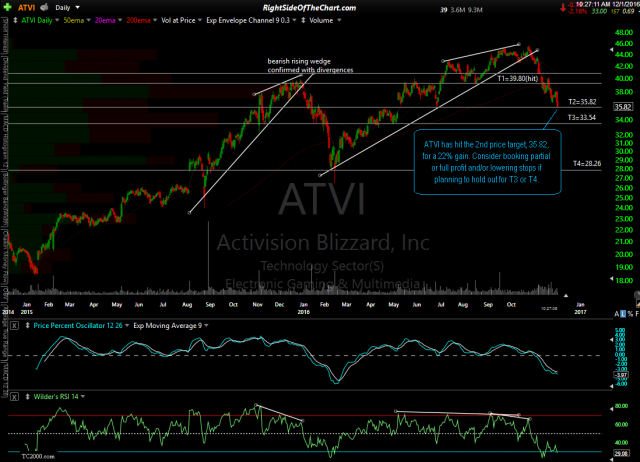
- ATVI daily Nov 1st
-
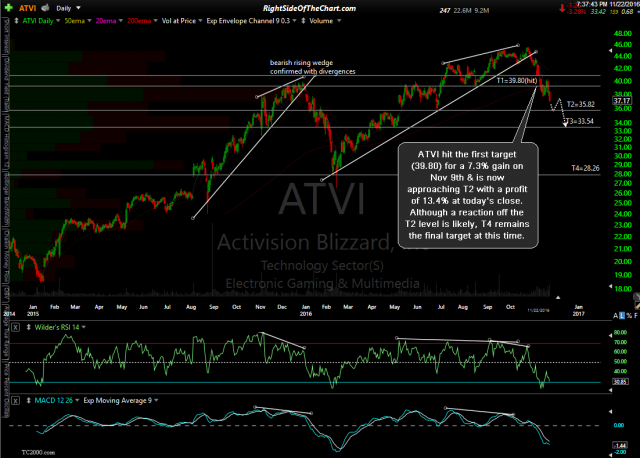
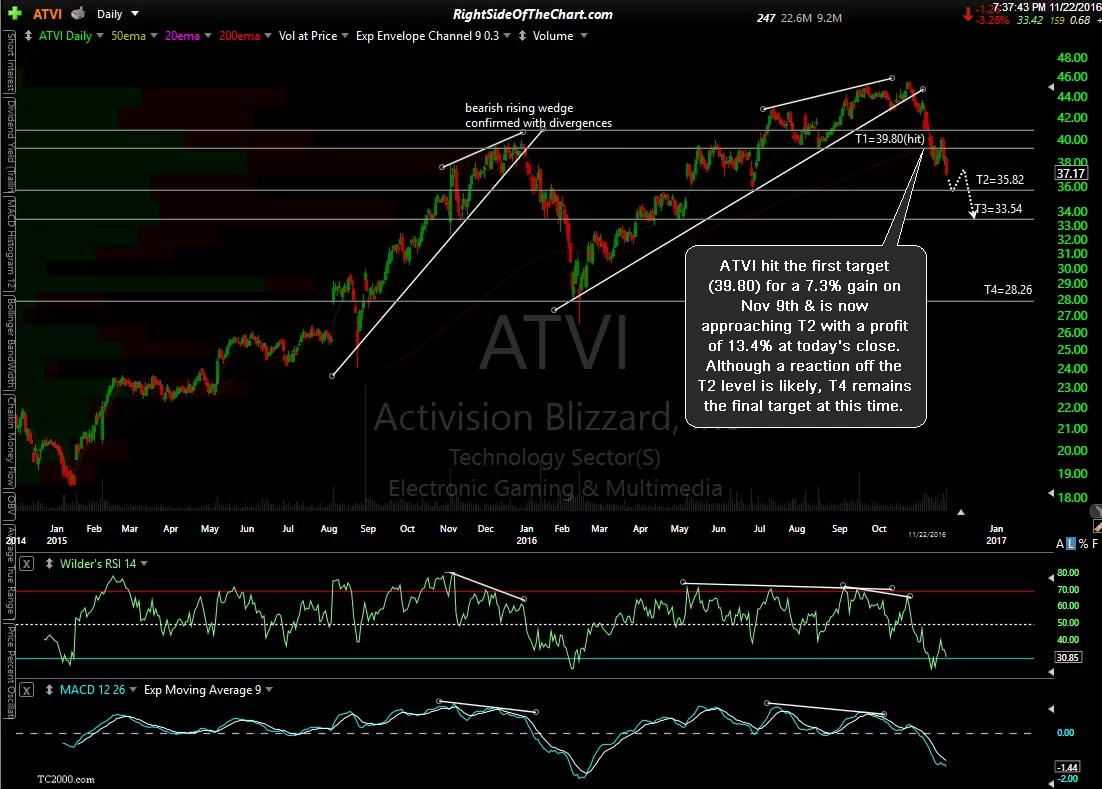
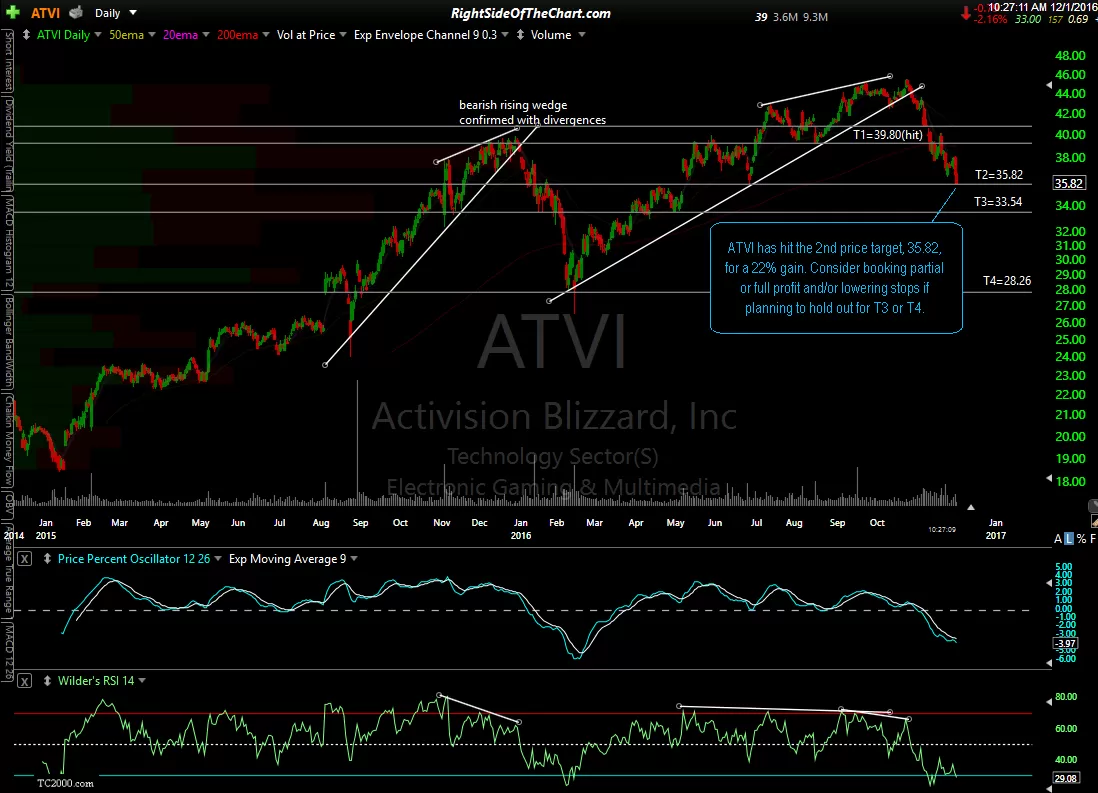
- ATVI daily Nov 22nd
-
- ATVI daily Dec 1st
-
- ATVI daily Jan 4th
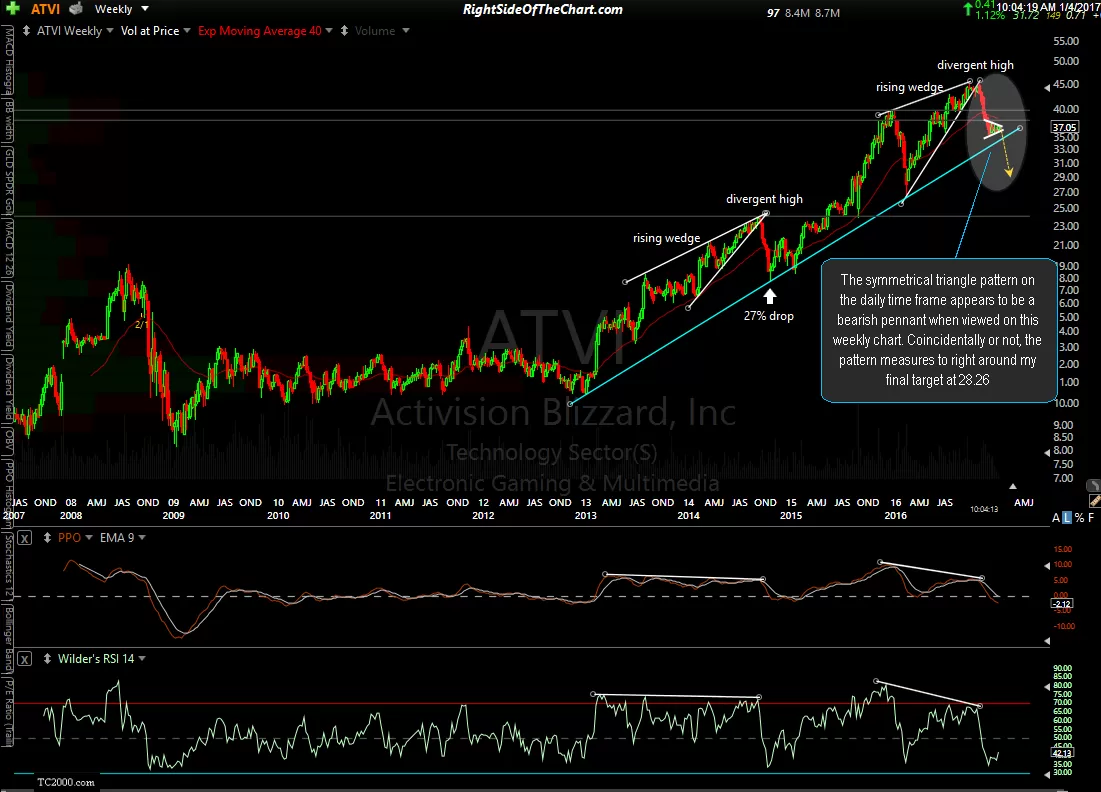
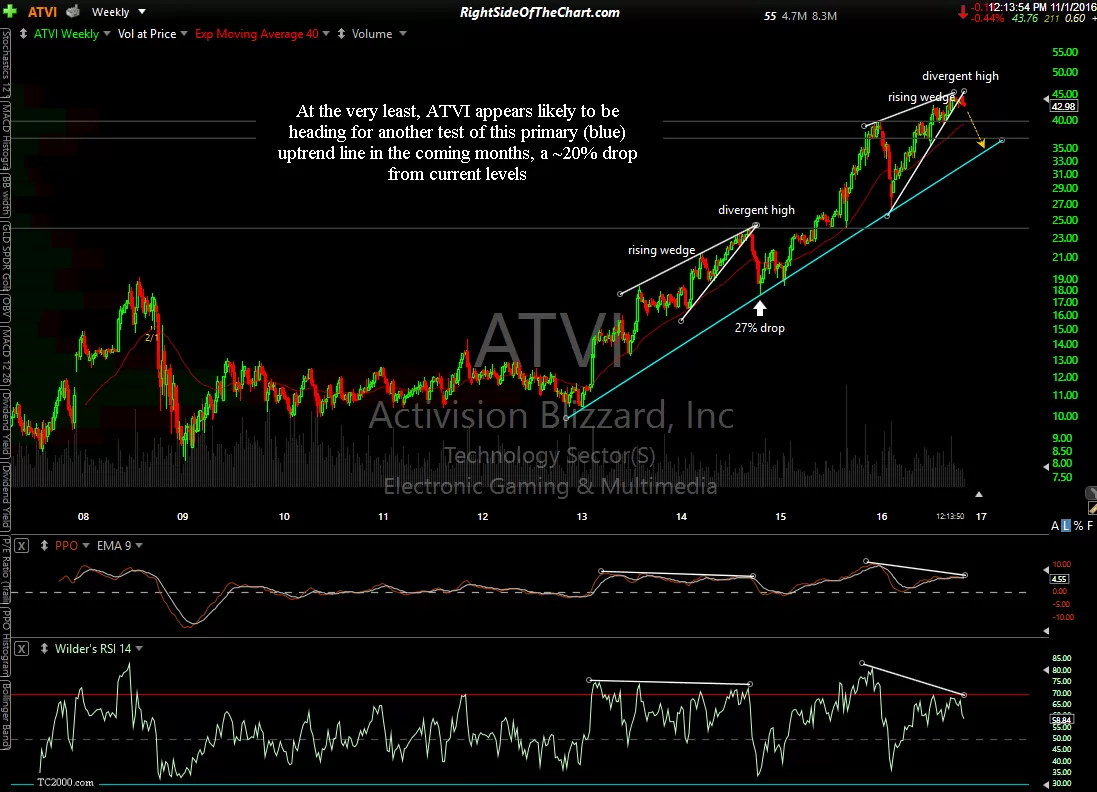
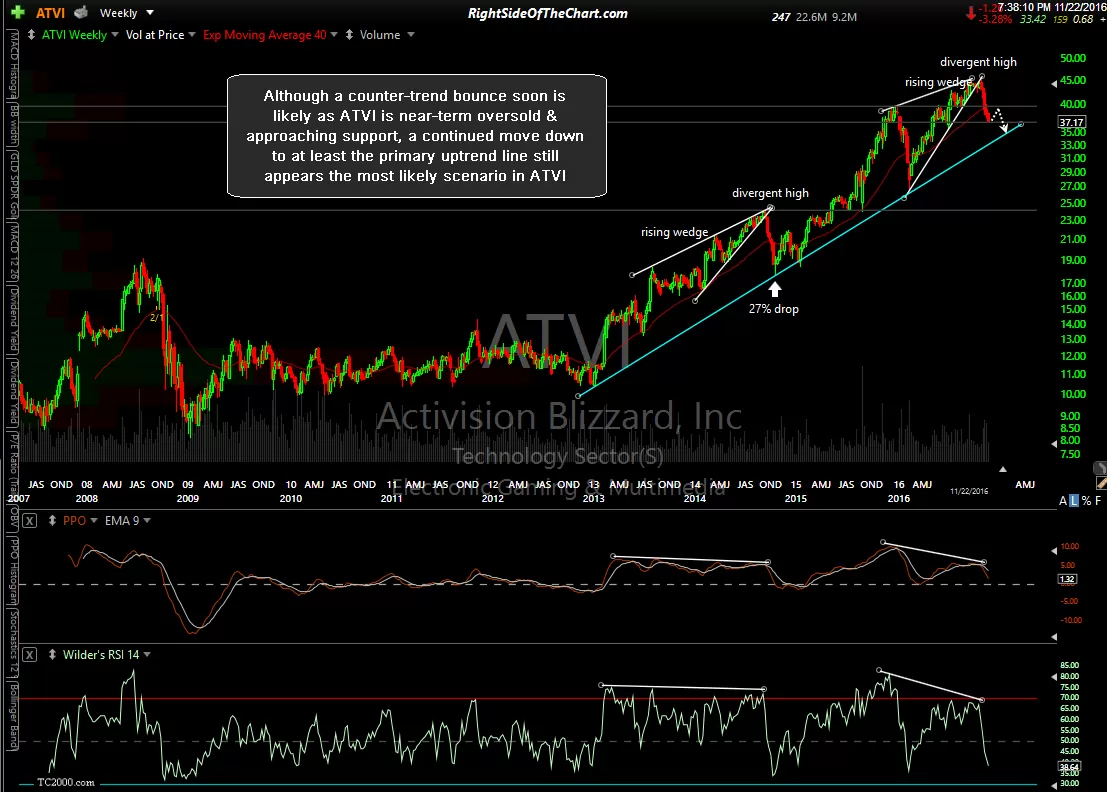
Typically, symmetrical triangle patterns break in the direction leading up to the formation of the pattern although this one could break either way, especially considering the fact that Activision has already exceeded the measured target for the bearish rising wedge pattern on the daily time frame. However, the bigger picture (weekly chart) indicates that ATVI may be in the early stages of a new primary down trend & appears to have formed a bearish pennant continuation pattern just above this bull market uptrend line shown on this weekly chart (last one preceded by the previously posted weekly charts):
-
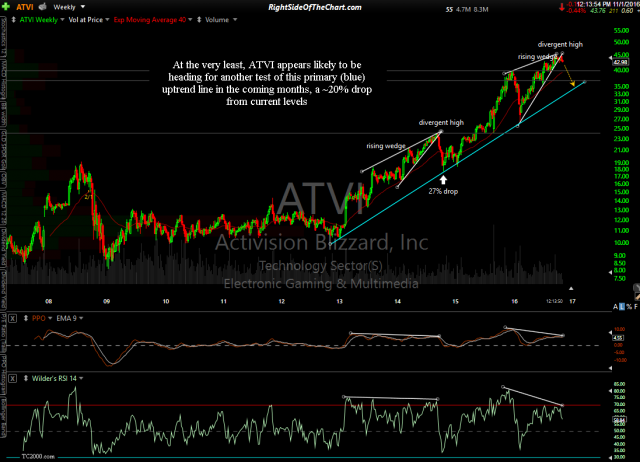
- ATVI weekly Nov 1st
-
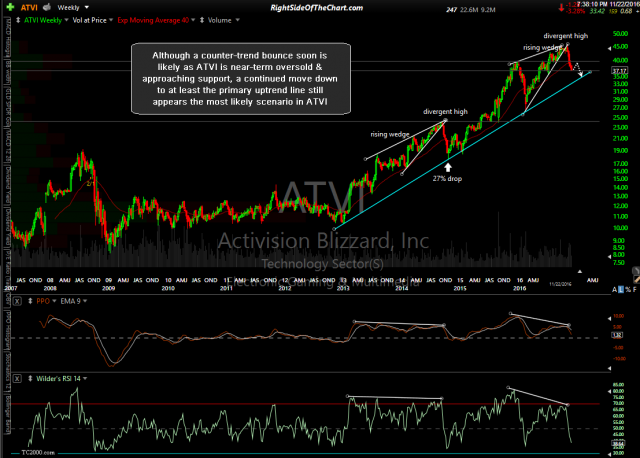
- ATVI weekly Nov 22nd
-

- ATVI weekly Jan 4th