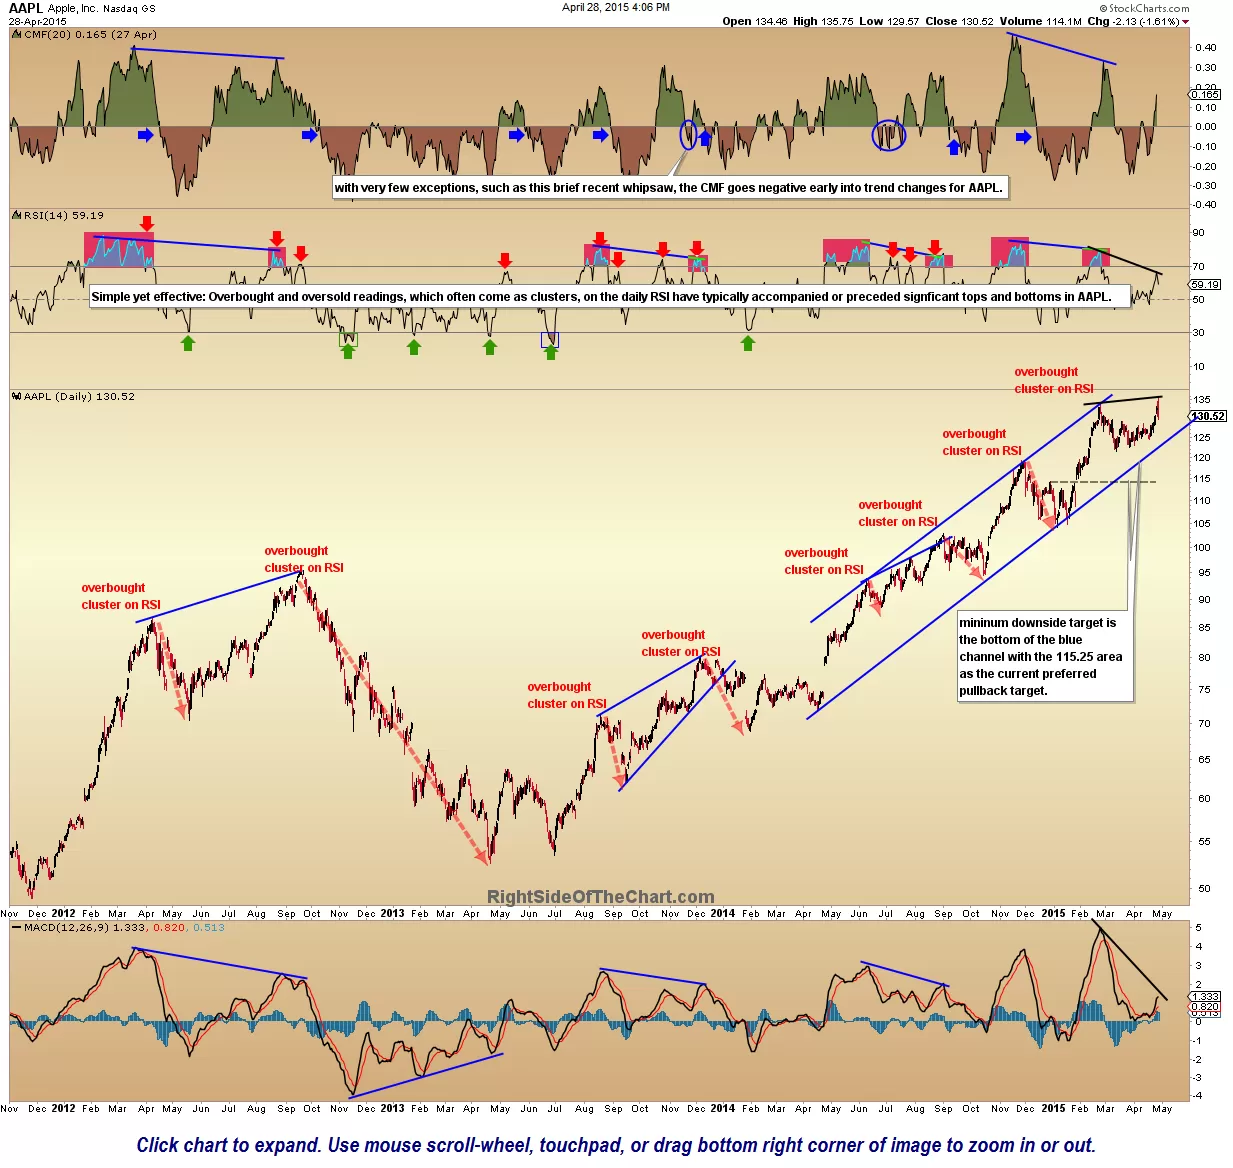
In this post back on April 28th, it was pointed out that AAPL (Apple Inc) printed a bearish engulfing candlestick pattern that day. At the time, it was stated that this potentially bearish topping candlestick pattern needed to be confirmed with additional bearish price action. So far that has been the case, with the stock experiencing additional selling from that point which brought AAPL to my first price target, the bottom of the ascending price channel.
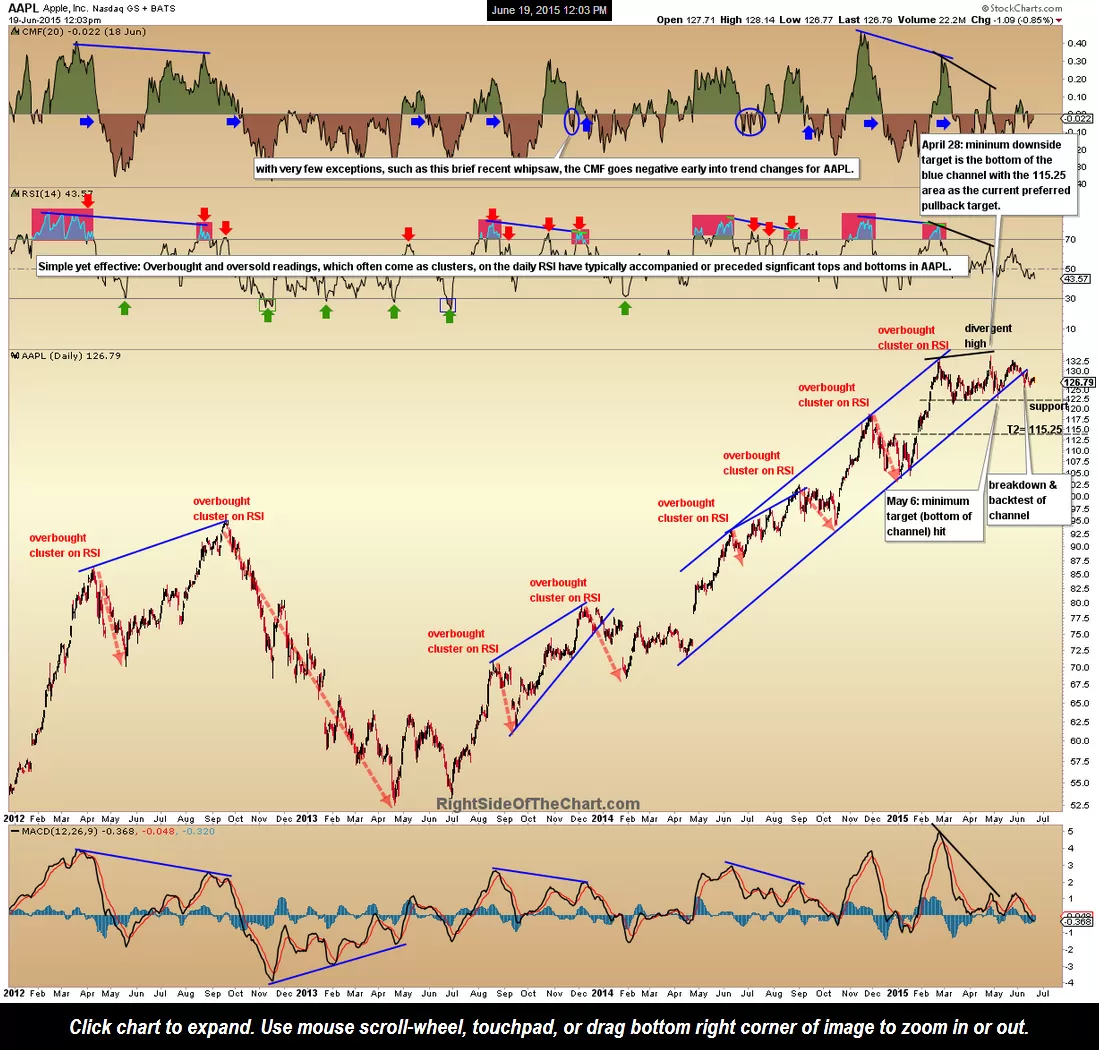
From there, the stock bounced, as would be expected on the initial tag of a key support level. However, unlike most other major US stock indices ($SPX, $DJIA, $COMP, etc…), Apple failed to make a new high, instead turning lower once more and recently breaking below that ascending price channel with prices continuing lower after a successful backtest.
The first chart below is from that April 28th post, the day APPL had just printed its all-time high which resulted in heavy profit taking (high volume), ending the day sharply lower to print the bearish engulfing candlestick. The second chart is today’s updated daily chart, highlighting the subsequent price action discussed above. As back then, I favor a continued move down tot he 115.25 area although I have added a new, minor support level which comes in around 122-123 area where a reaction is likely.
Should AAPL continue to move down towards the 115.25 support level, a drop of roughly 10% from current levels, being the largest weighted component of both the S&P 500 and Nasdaq 100, Apple would almost certainly drag the broad markets down with it.
-

- AAPL daily 2 April 28th
-

- AAPL daily June 19th