

By request of a couple of members on the other side of the pond, here’s my take on the London FTSE 100, Sydney All Ordinaries & the S&P ASX 200 Composite Indices. Following the recent breakout above significant resistance to new highs, the $FTSE is now back-testing that level, now key support, from above. While this pullback to support could provide an objective long entry with a resumption of the uptrend to following, the charts appear to indicate that the recent breakout is likely to fail with more downside in the coming weeks or months.
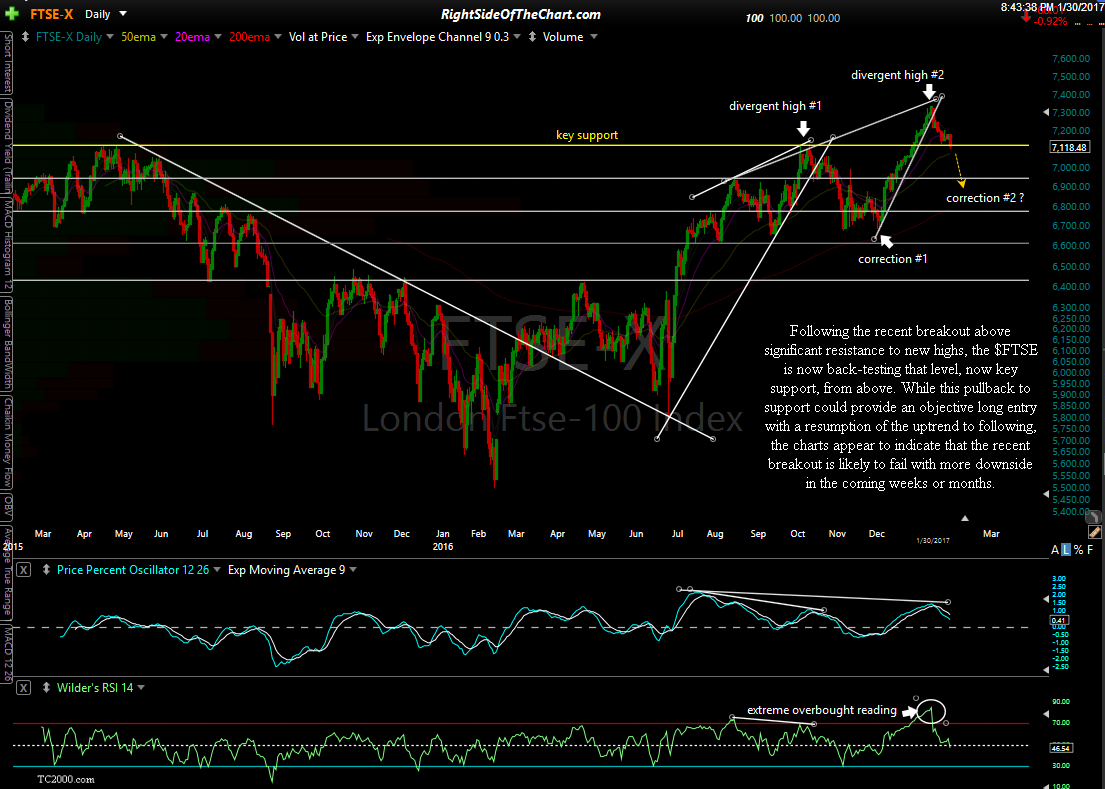
$FTSE daily Jan 30th
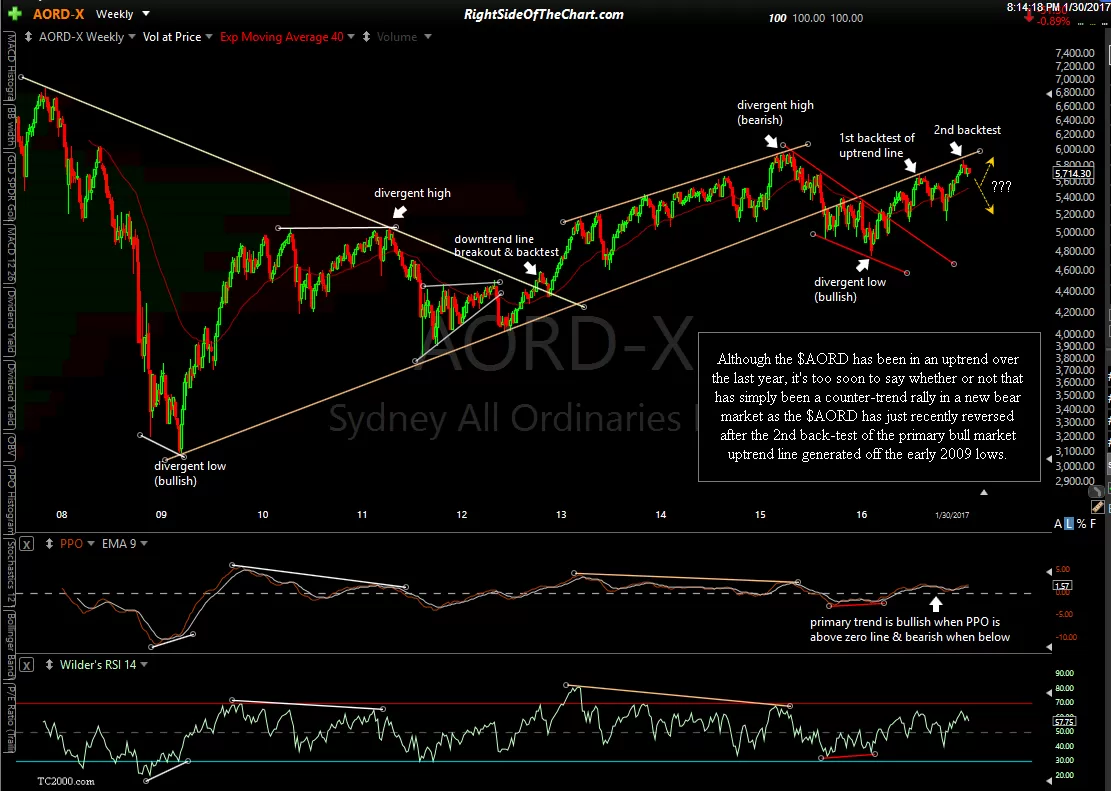
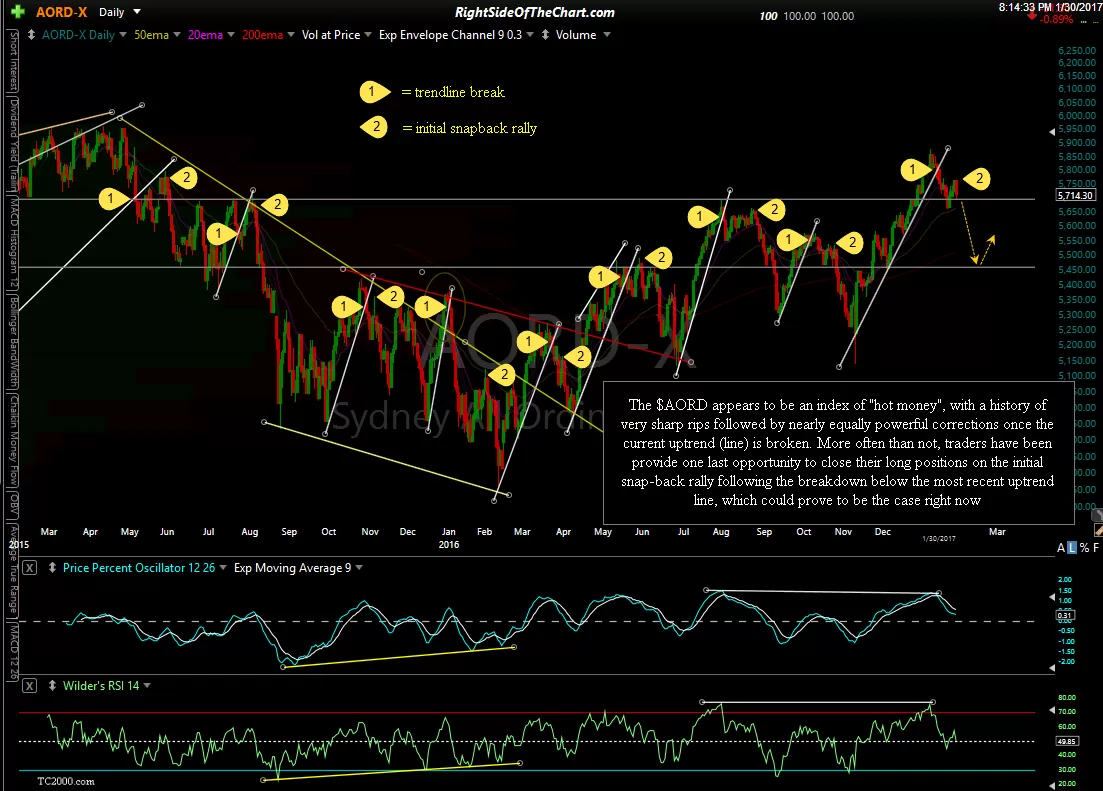
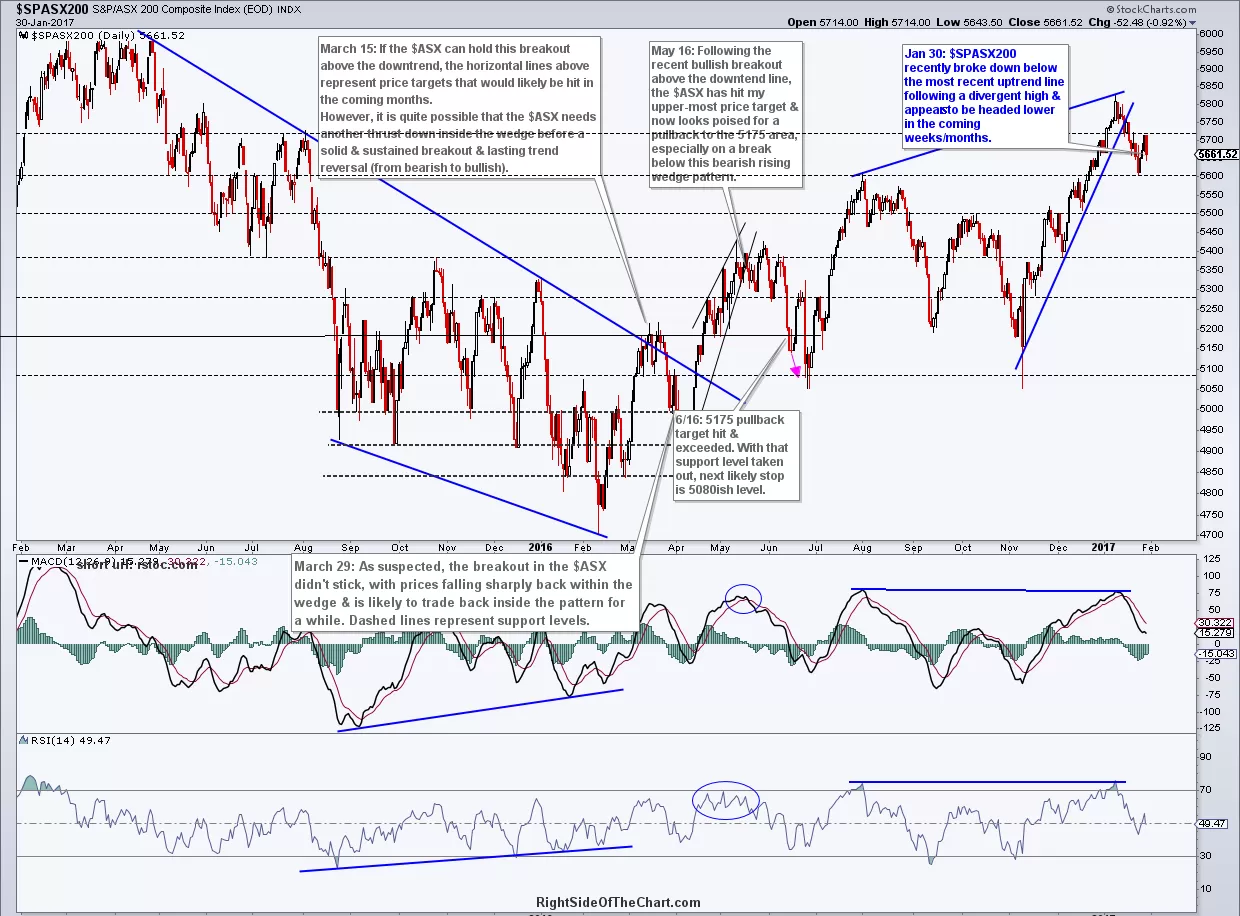
Zooming down to the daily time frames of both the $AORD as well as the S&P ASX 200 Composite Index, the $AORD appears to be an index of “hot money”, with a history of very sharp rips followed by nearly equally powerful corrections once the current uptrend (line) is broken. More often than not, traders have been provided one last opportunity to close their long positions on the initial snap-back rally following the breakdown below the most recent uptrend line, which could prove to be the case right now. The $SPASX200 also recently broke down below its comparable uptrend line following a divergent high & appears to be headed lower in the coming weeks to months.
note: Click the first chart in the series above to expand, then click anywhere on the right of the chart to advance to the next expanded chart image. Once expanded, all charts can be further zoomed or panned for more detail using a mouse scroll-wheel, touchpad or right-click, hold & drag to pan.
@teeps01 @vim2
note: Click the first chart in the series above to expand, then click anywhere on the right of the chart to advance to the next expanded chart image. Once expanded, all charts can be further zoomed or panned for more detail using a mouse scroll-wheel, touchpad or right-click, hold & drag to pan.
@teeps01 @vim2