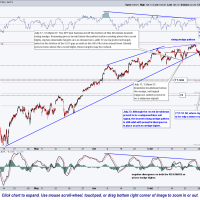
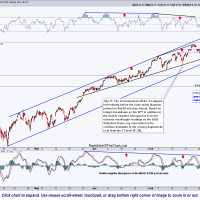
After the brief whipsaw sell signal (false breakdown) in the SPY two weeks ago today, price went on to breakdown & backtest the rising wedge pattern & have moved impulsively lower since, tagging the S1 support level (minor support) this morning. As minor support levels (S1, S2, etc…) are levels where I expect any reactions (i.e.- a consolidation and/or bounce) to be relatively minor in scope & duration, my current expectation is to see prices continue lower towards at least the T1 zone (192.50ish area) in the coming sessions. Note how the Q’s are also approaching their S1 level as well, all the more reason to expect a reaction in the broad markets from around current levels before a resumption of the current short-term downtrend.
- SPY 60 minute July 31st
- QQQ 60 minute July 31st
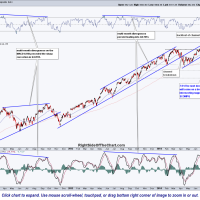
- $COMPQ daily July 31st
Looking at the bigger picture, the $DJIA (Dow Jones Industrial Average) has clearly taken the lead on this move lower by breaking below it’s rising wedge last Friday, July 25th, and moving lower since. That puts both the S&P 500 & the $DJIA on clear near-term sell signals (still some work to be done to trigger longer-term sell signals) with the Nasdaq Composite hovering just above dual intersecting support levels as shown on this daily chart. Keep in mind that when the market is moving fast, prices may have already taken out support or resistance levels on the static charts by the time that you read these posts. During times of increased volatility or more frequent technical developments, I will make every effort to keep the live charts updated, particularly the major US indices. Daily & weekly charts of the major US indices can be found on the Live Charts page and I am considering adding links to the 60 minute charts there as well, although only stockcharts.com subscribers are able access the 60 minute charts via the links (see below for a go-around to that issue). Also note that I plan to review & likely update the downside price targets. Click the links below to view the live annotated charts of the following:
SPY 60 minute QQQ 60 minute $SPX daily $DJIA ($INDU) daily $COMPQ daily
non-stockscharts.com subscribers should be able to cut & paste the following URLs in the address bar of their web browser to view the 60 minute charts:
http://stockcharts.com/c-sc/sc?s=SPY&p=60&yr=0&mn=4&dy=0&i=p69927574797&a=359792442&r=1406817944248
http://stockcharts.com/c-sc/sc?s=QQQ&p=60&yr=0&mn=4&dy=0&i=p69720840045&a=360945467&r=1406818125483


