
/ES (S&P 500 futures) has broken slightly below its 60-minute bearish rising wedge (uptrend line off the March 30th low), although /NQ (Nasdaq 100 futures) remains slightly above its comparable uptrend line in pre-market, & needs to also break below it to confirm a sell signal. 60-minute chart of /ES with initial price targets, followed by the previous (Friday’s) & updated 60-minute charts of /NQ below.
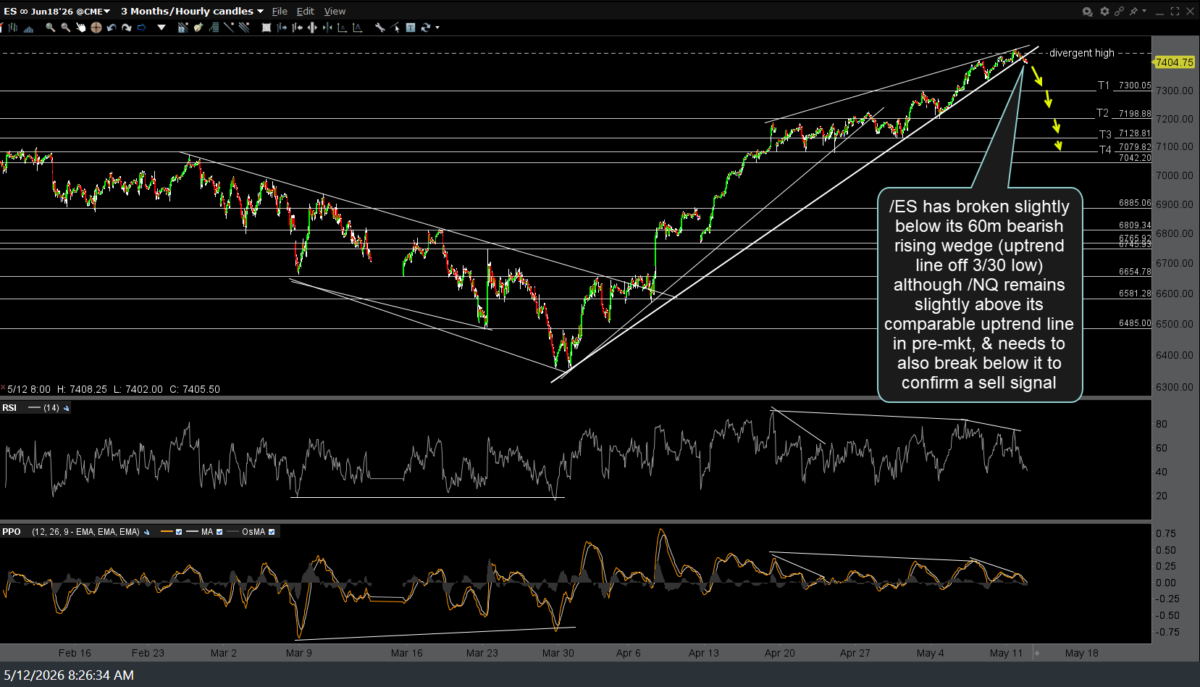
ES 60m May 12th
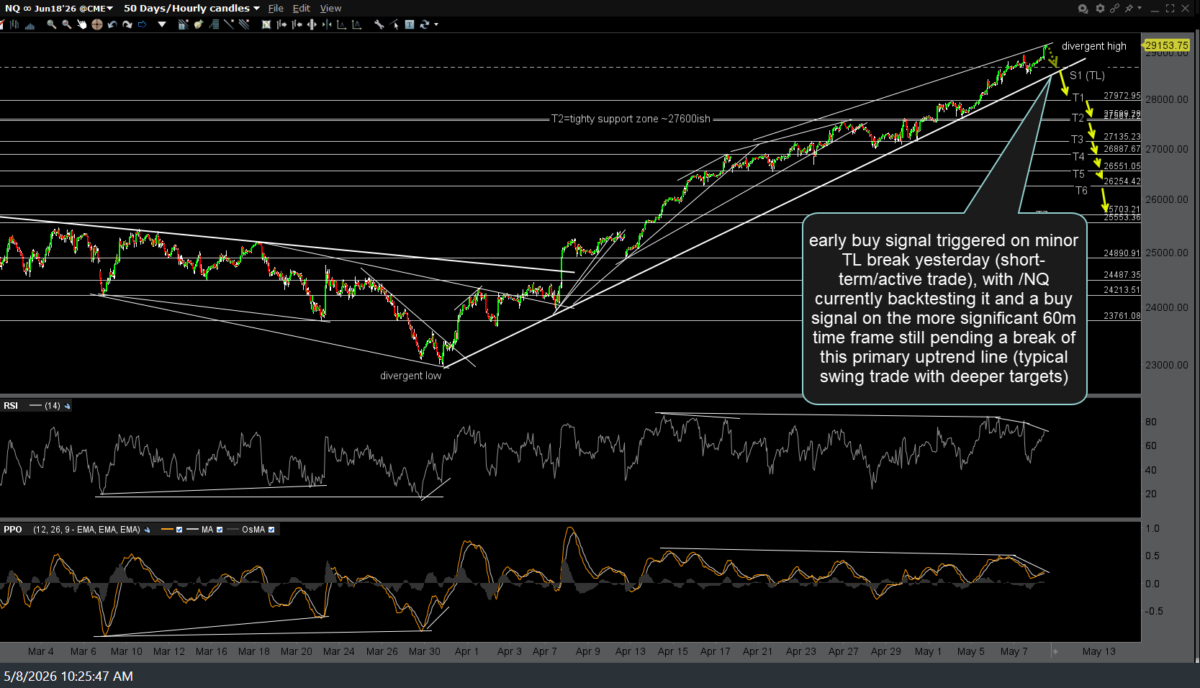
NQ 60m May 8th
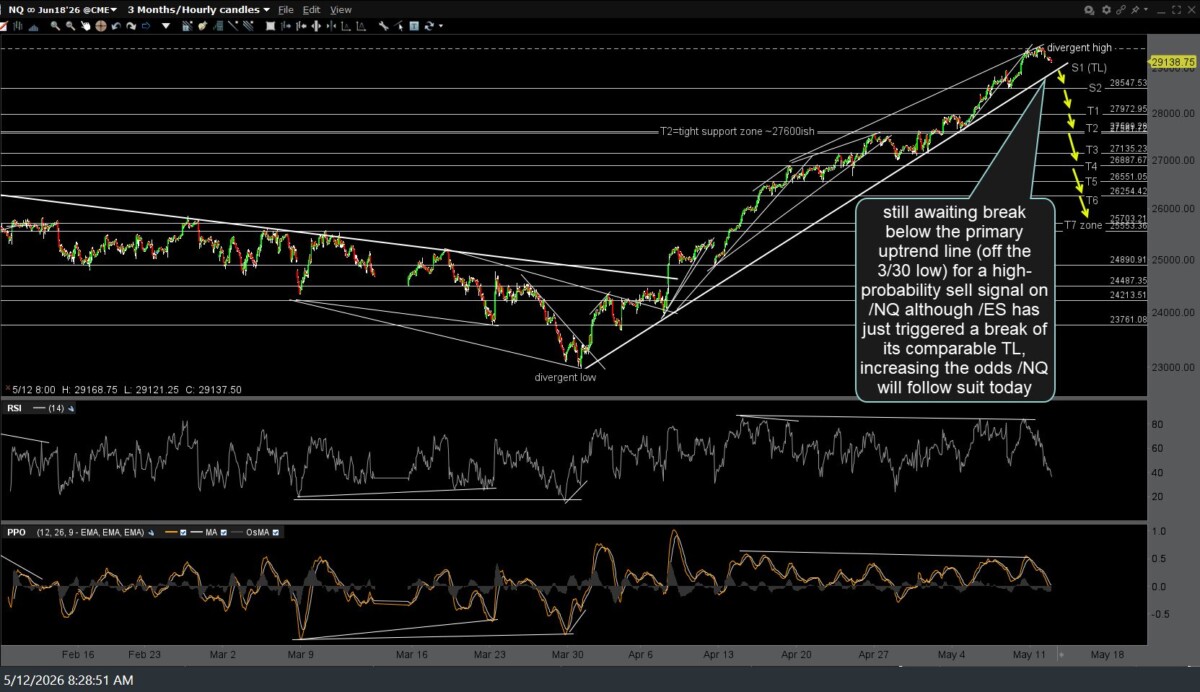
NQ 60m May 12th
Should /NQ trigger a sell signal on a solid break below the uptrend line once the regular trading session is underway, I will follow up with updated charts of QQQ, SOXX, & XSD, the latter of which are likely to follow suit (breaking below their comparable uptrend lines), should /NQ & QQQ clearly break down.