
As the yield on the 30-yr US Treasury bond remains within “spitting distance” of not only a new multi-year high but even multi-decade highs that would lift rates to levels not seen since the turn of the millennium, I continue to monitor the “long bond” very closely. Multi-decade monthly chart of $TYX (30-year Treasury bond yield) below.

$TYX monthly Aug 8th
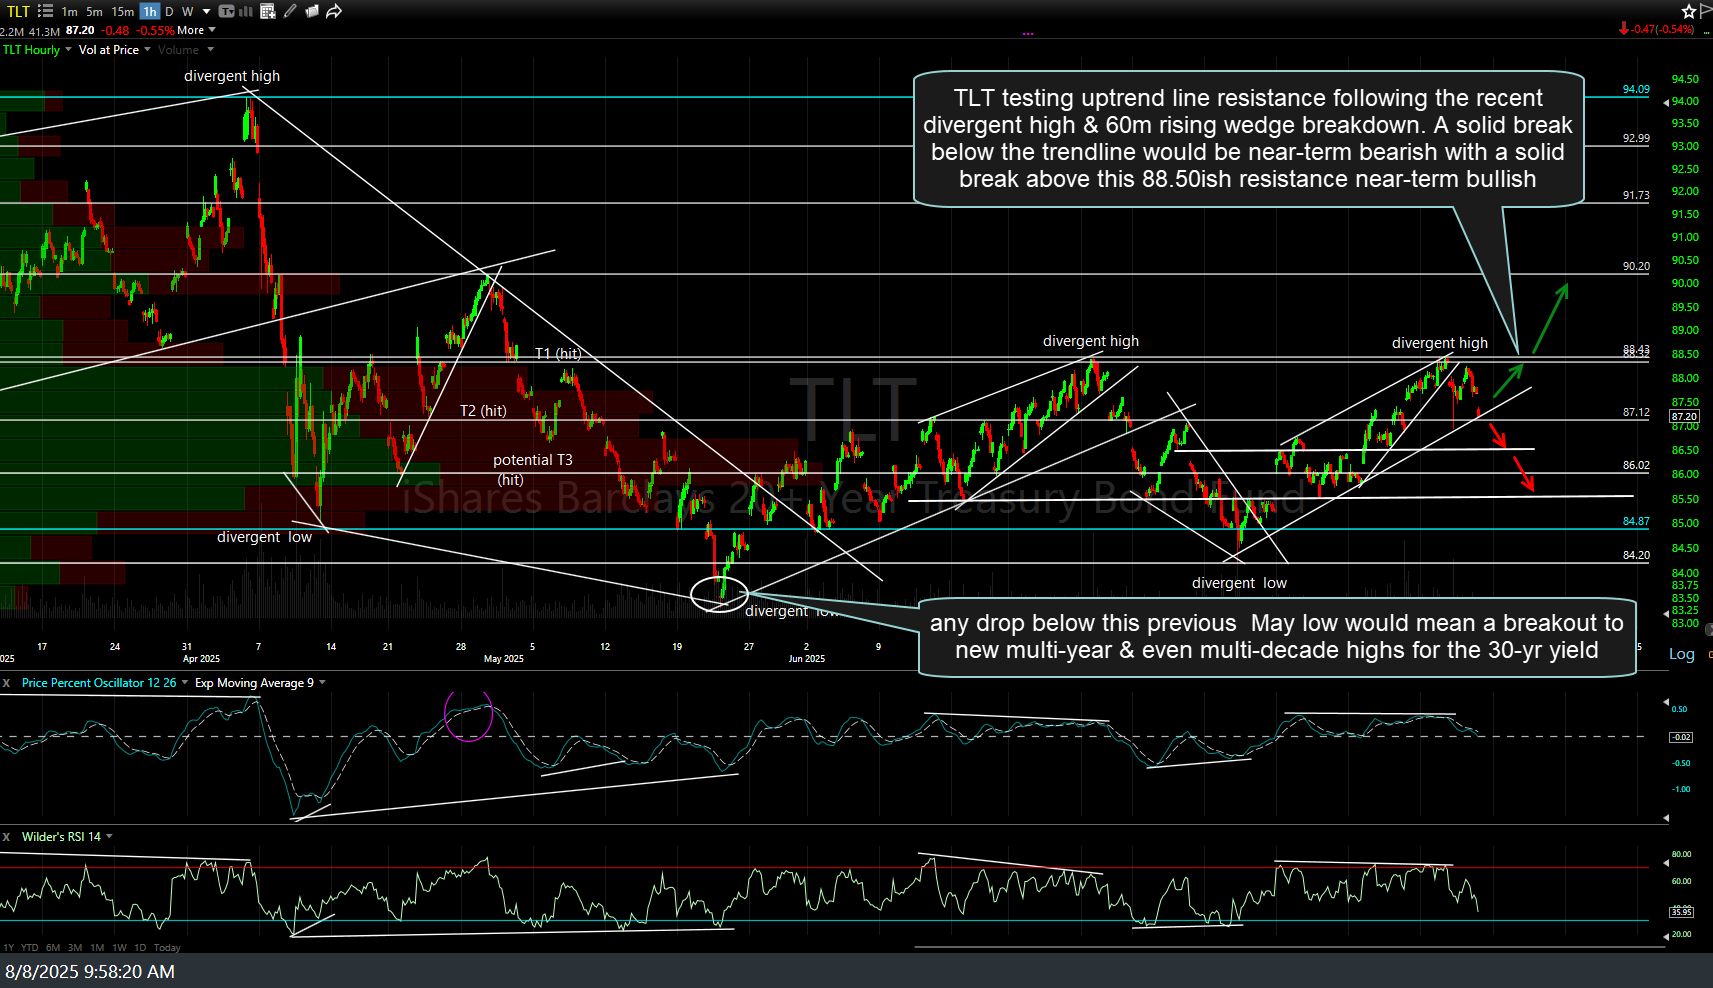
As the developments & technical changes on the monthly charts can take, well… months (or even years) to play out, I like to step down to the weekly, daily, & even intraday charts to get more visibility on the near-term direction of the long bond. As shown on the 60-minute chart below, TLT (20-30 yr Treasury bond ETF) is currently testing uptrend line support following the recent divergent high & 60m rising wedge breakdown. A solid break below the trendline would be near-term bearish, while a solid break above this 88.50ish resistance would be near-term bullish.
TLT 60m Aug 8th
While I continue to favor an ultimate breakout to new highs in the 30-year yield (i.e., new multi-year lows in TLT or the 30-yr bond price), and even a breakdown below this 60-minute uptrend line that is currently being tested, as I like to say: Support is support until & unless broken. As such, the next sell signal would come on a solid break & 60-minute candlestick close below this uptrend line (my preferred scenario), whether TLT bounces here first or not.
Likewise, should TLT hold & bounce off this trendline (or maybe a brief whipsaw, false breakdown below it followed by a recovery) and rally from there, a solid & sustained break above the 88.50ish resistance just above, especially if the current negative divergences are taken out, would be near-term bullish for TLT, quite likely taking it up to that next resistance level around 90.20.
Whether one cares to trade TLT (or /ZB, the 30-yr T-bond futures) or not, a substantial rise in yields from current levels would almost certainly be a headwind for the stock market while falling yields (TLT rallying), would be a net positive for the stock market (*unless Treasuries are rallying on a flight-to-safety bid caused by an impulsive sell-off/correction in the stock market). Once again, that first scenario (rising yields/falling Treasury prices) has only one likely outcome on the stock market, IMO: Down/Bearish with the other scenario contingent on WHY yields are falling at the time (an organic abatement in rates -OR- a panic sell-off in the stock market.
Either way, something to continue to monitor closely at this time with TLT currently testing support.