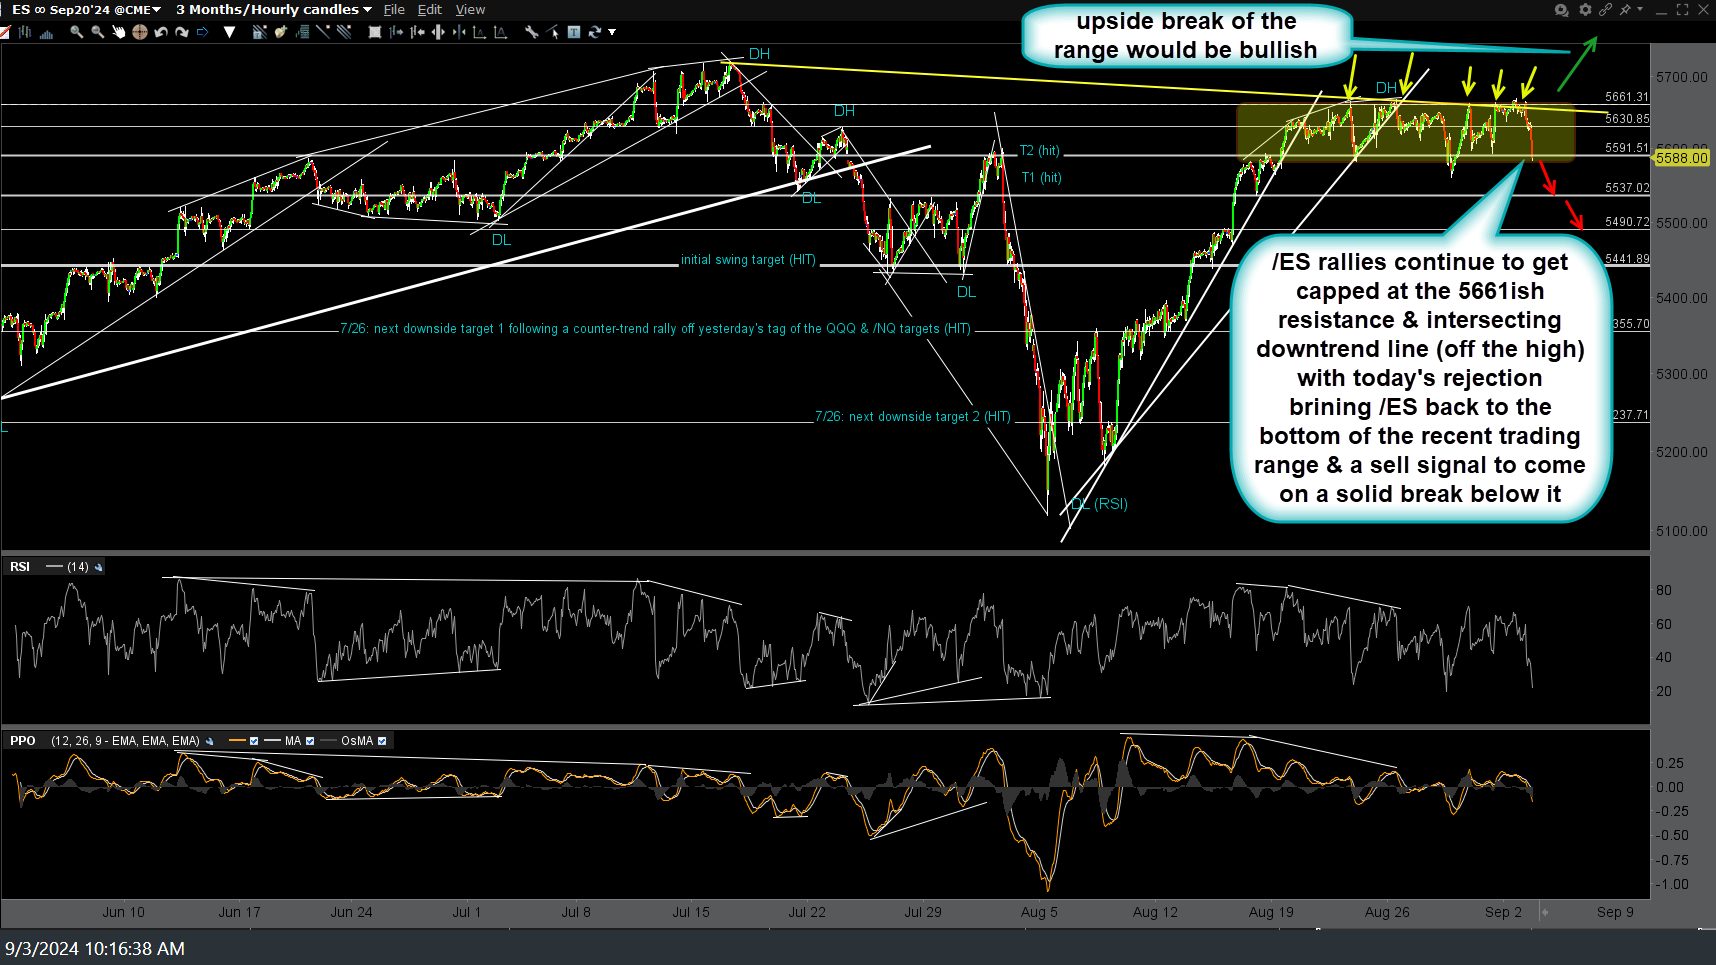
/ES (S&P 500 futures) rallies continue to get capped at the 5661ish resistance & intersecting downtrend line (off the high) with today’s rejection bringing /ES back to the bottom of the recent trading range & a sell signal to come on a solid break below it. A solid upside breakout above the recent trading range & primary downtrend line would be bullish while a solid break below the trading range bearish. 60-minute chart below.
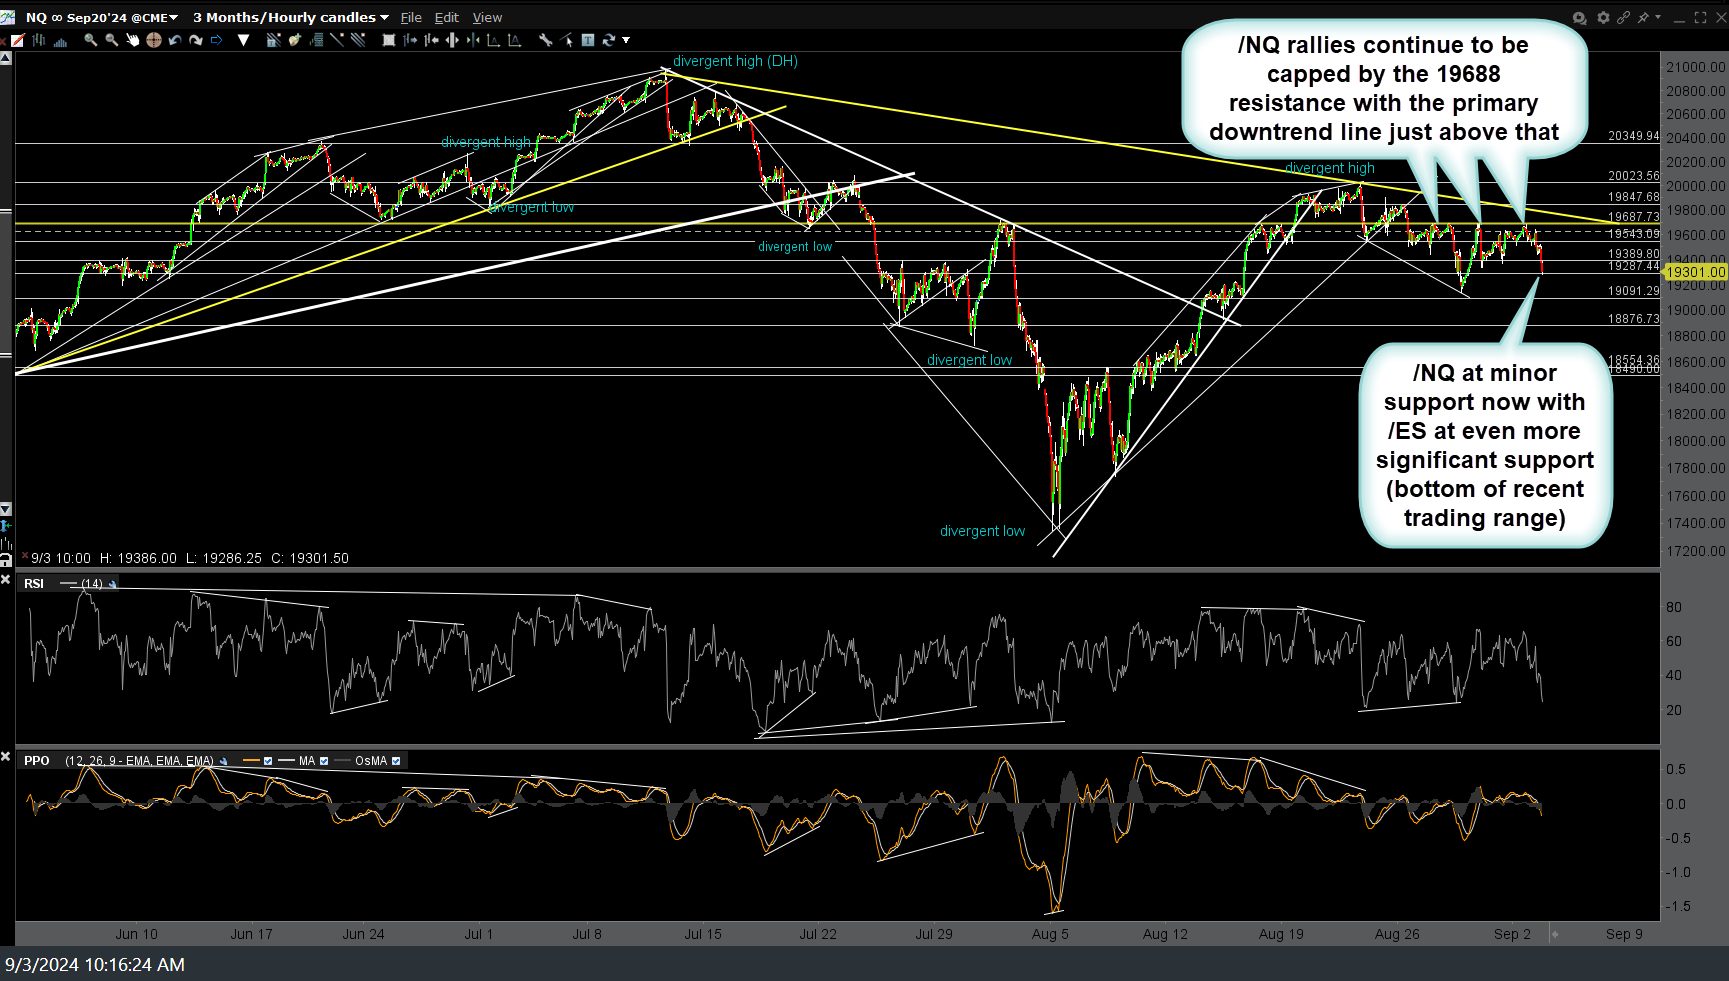
Likewise, /NQ (Nasdaq 100 futures) rallies, including today’s, continue to be capped by the 19688 resistance with the primary downtrend line just above that. /NQ has now fallen to minor support now with /ES at even more significant support (bottom of recent trading range). 60-minute chart below.
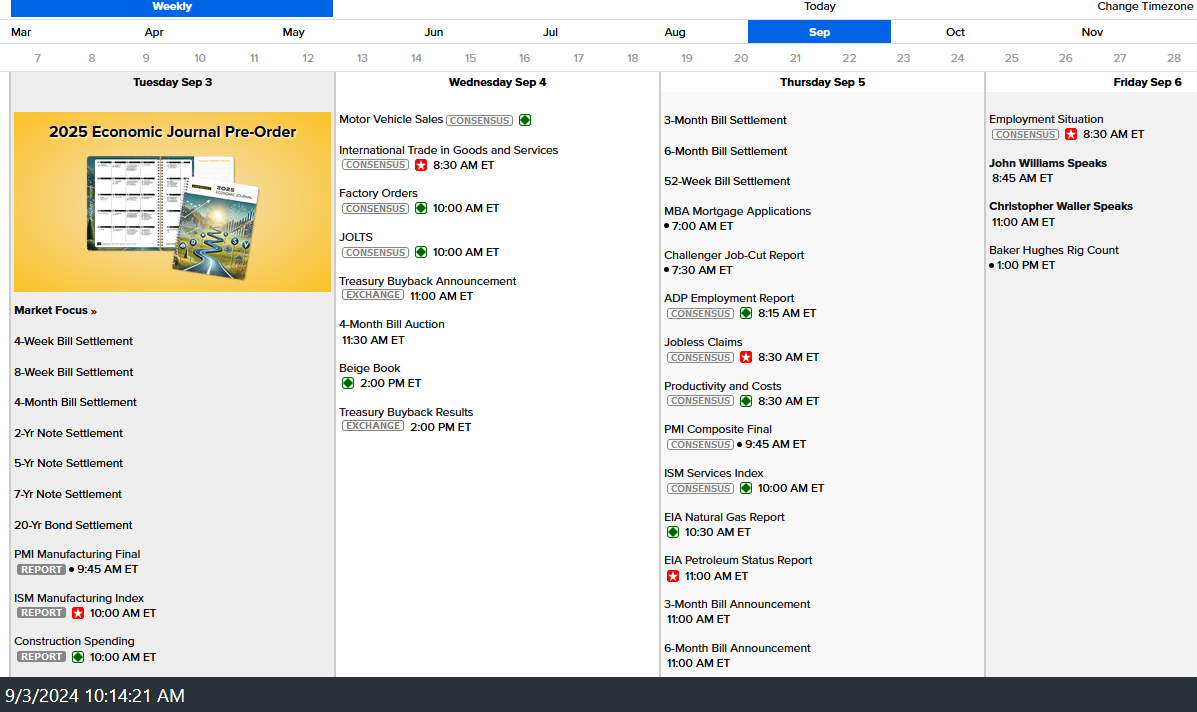
Also, keep in mind that we have a very heavy economic calendar this abbreviated trading week with plenty of potential market-moving reports from today through Friday’s Employment Report in addition to the 2nd largest US chip maker, AVGO (Broadcom), reporting earnings after the market close on Thursday. As such, volatility should be expected and if the S&P 500 & Nasdaq start breaking below the support levels on the charts above (still likely, IMO), the $VIX is likely to rally (/VIX futures or $VIX tracking ETNs such as VIXY, etc.).
I’m also monitoring USD/JPY (Dollar/Yen pair) closely & will post some charts or include that in the next video as well as charts of SPY, QQQ, & IWM.


