I’m back home so updates will resume as normal today starting with an update on the intraday charts of the S&P 500 (/ES) & Nasdaq 100 futures (/NQ).
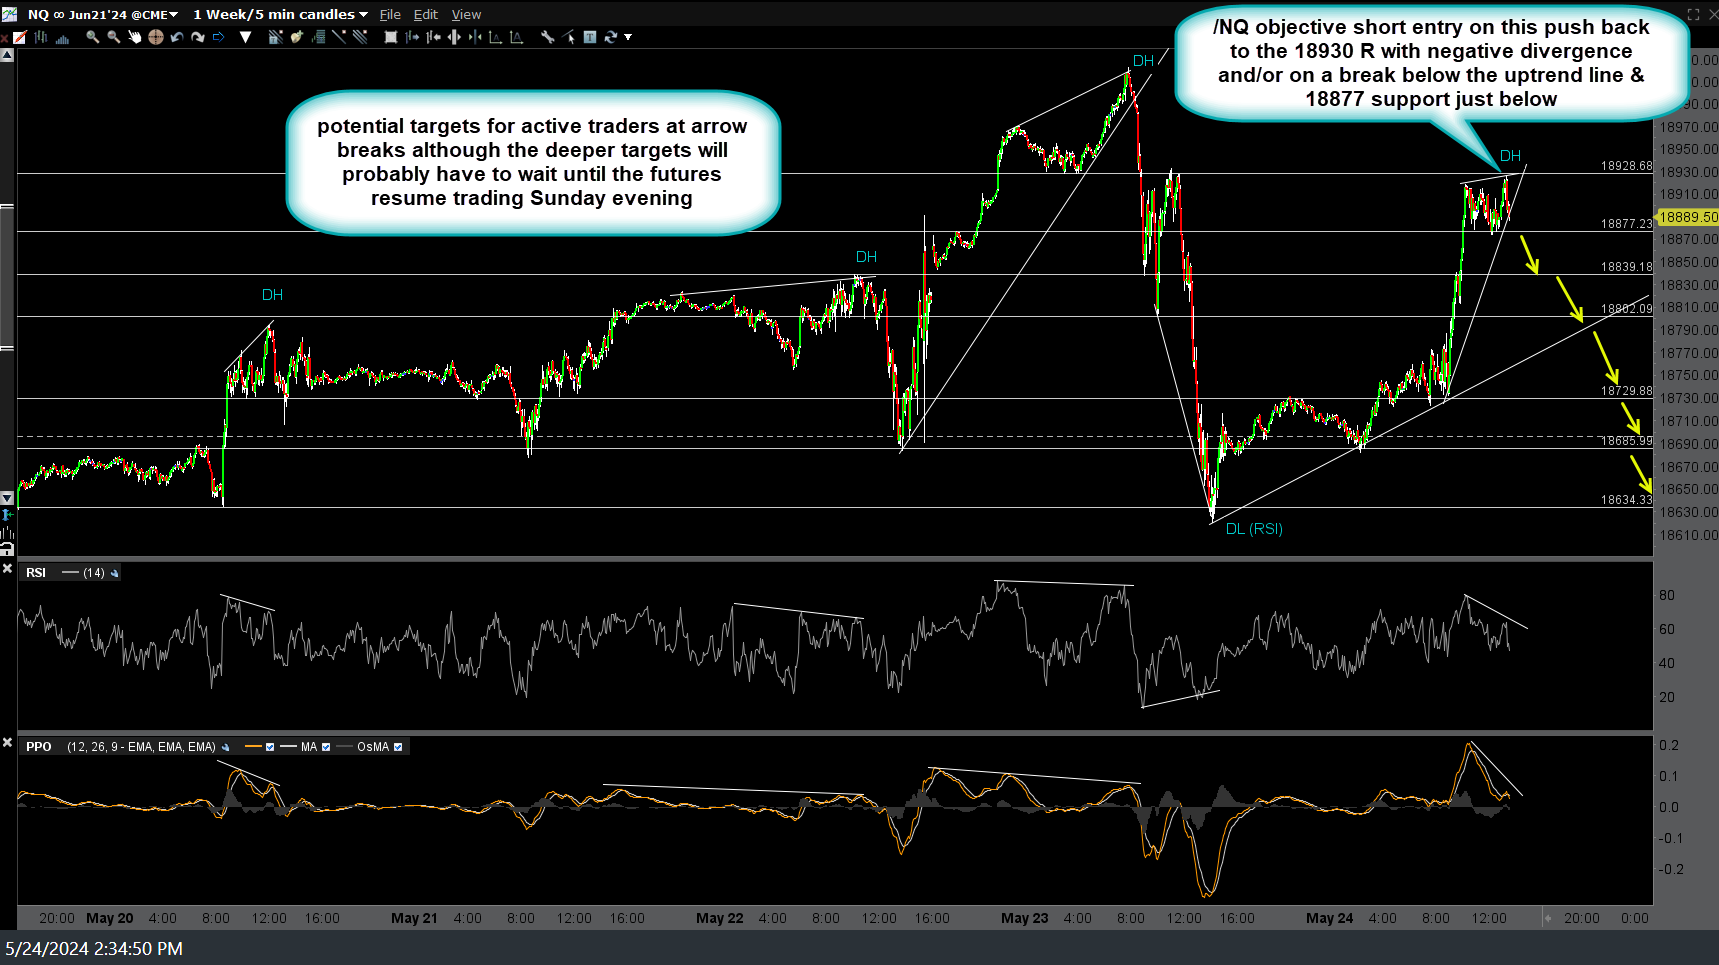
/NQ has broken below the 18802 support (T2 from the active trade idea posted on the 5-min charts on Friday, 1st chart below) after hitting it followed by a brief reaction/ consolidation, opening the door to the next target(s). I’ve also added a minor downtrend line which could trigger a counter-trend bounce, if taken out, & potentially providing another objective short entry should said bounce take /NQ or QQQ back to a decent resistance level(s).
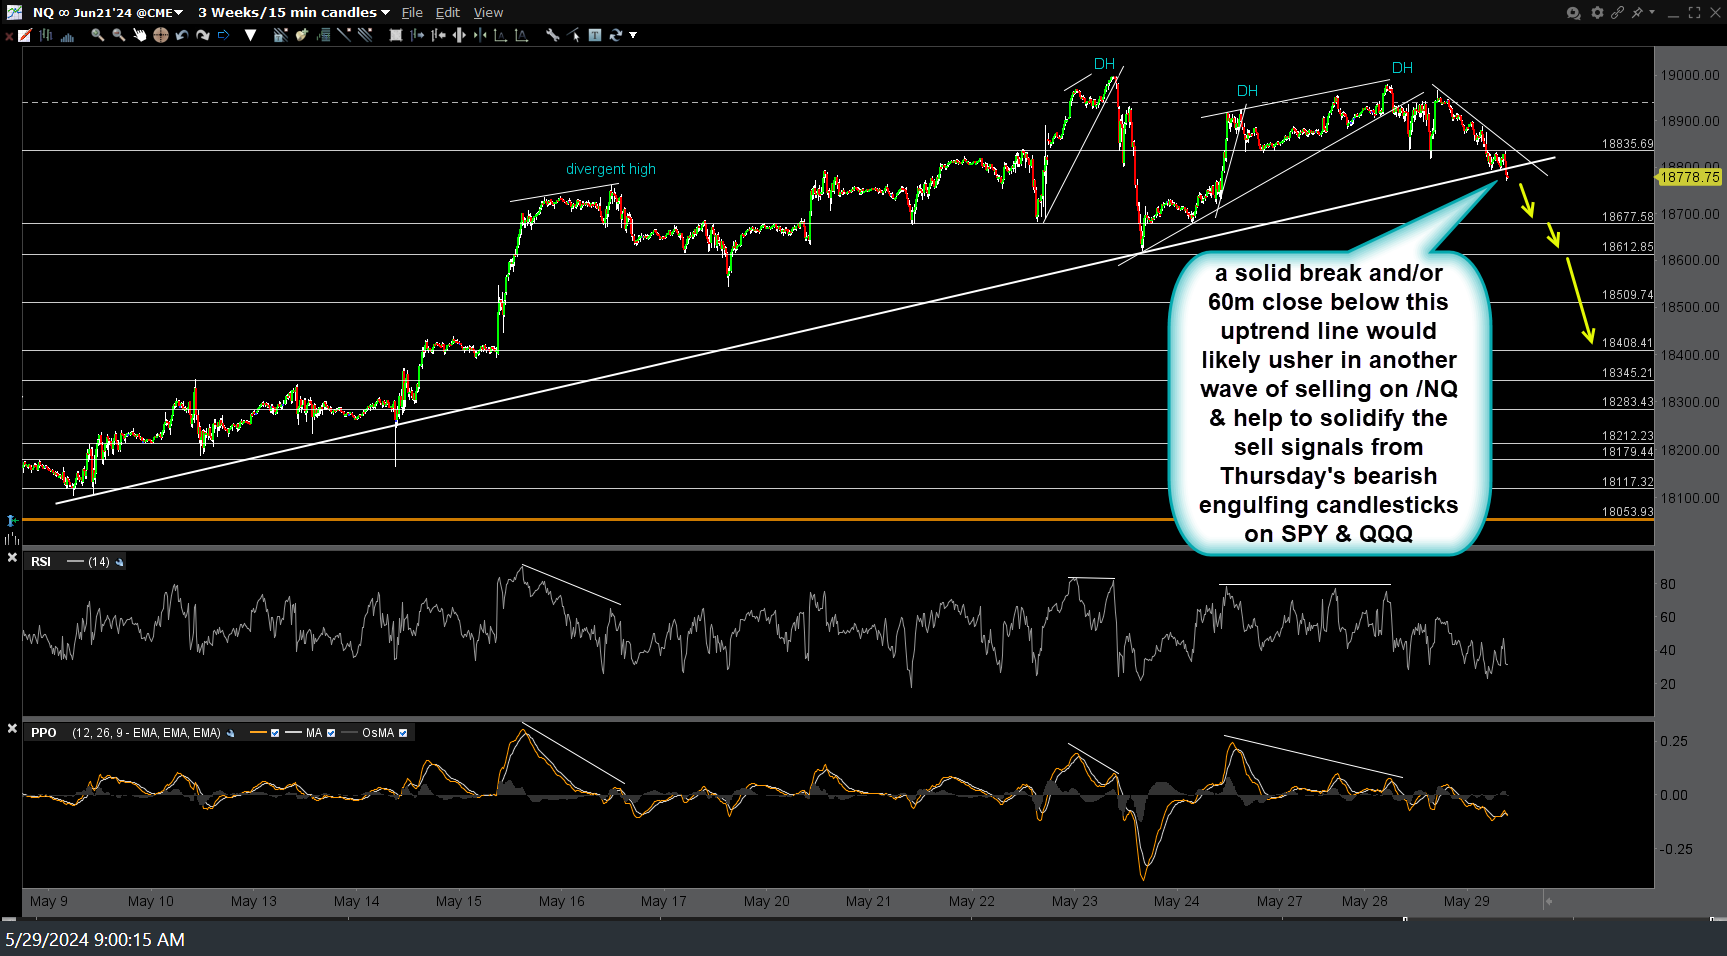
Zooming out to the 15-minute time frame, a solid break and/or 60-minute close (60m close preferred over 15m candlestick close) below this uptrend line would likely usher in another wave of selling on /NQ & help to solidify the sell signals from Thursday’s bearish engulfing candlesticks on SPY & QQQ.
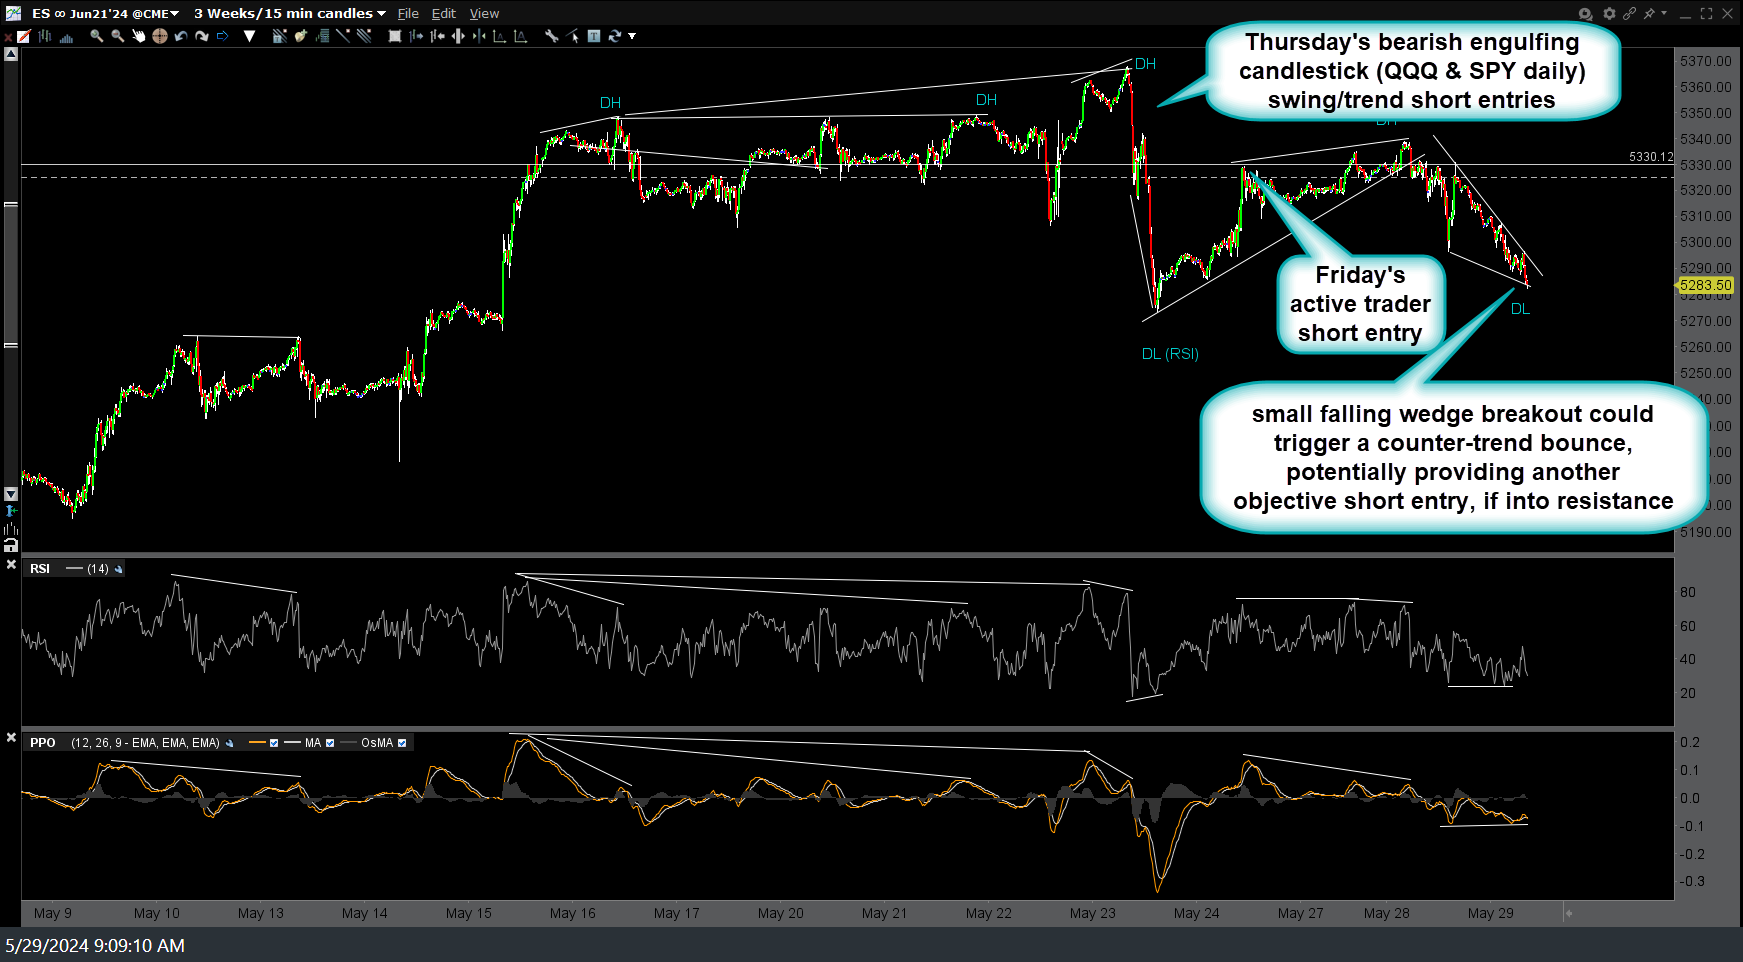
Ditto for the 15-minute chart of /ES, which also has a small bullish falling wedge/downtrend line which has the potential to trigger a counter-trend bounce, if taken out. However, the positive divergences on that time frame will be taken out, should /ES drift continue down much below current levels.
I’ll follow up with the charts of QQQ & SPY either in the comment section below this post or in a video shortly after the open today but just to reiterate, both QQQ & SPY remain below their respective bearish engulfing candlesticks (potential topping sticks & objective swing/trend short entries) they put in last Thursday.


