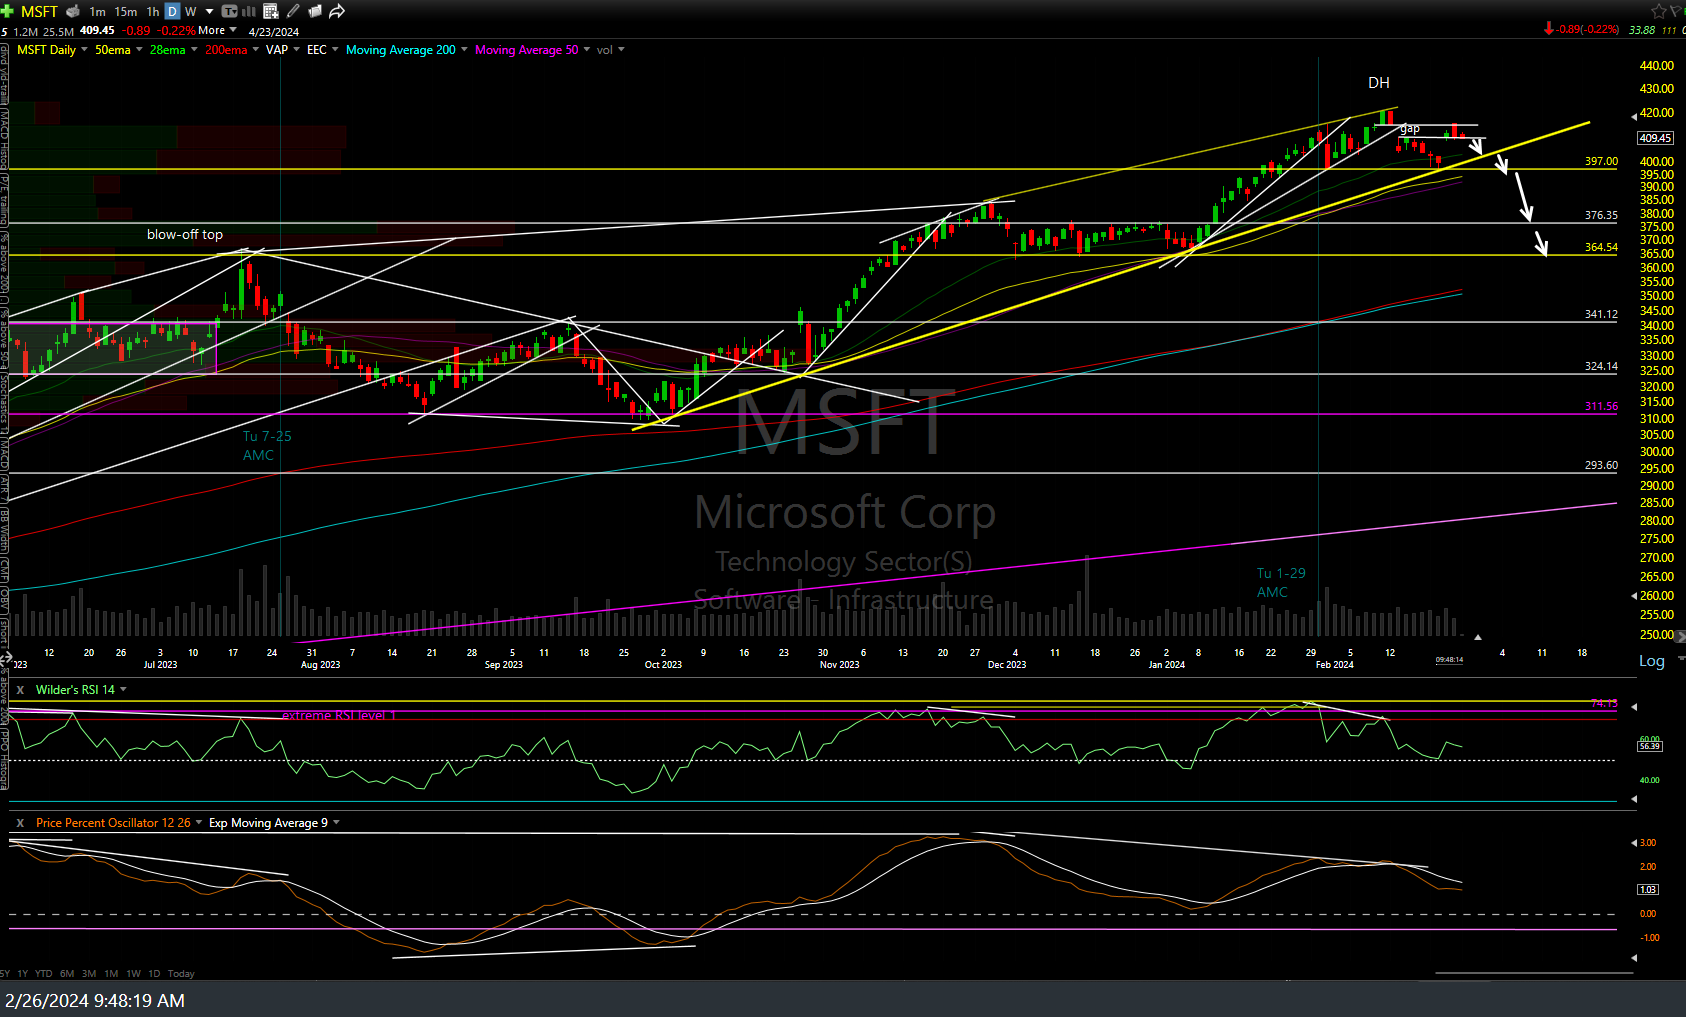
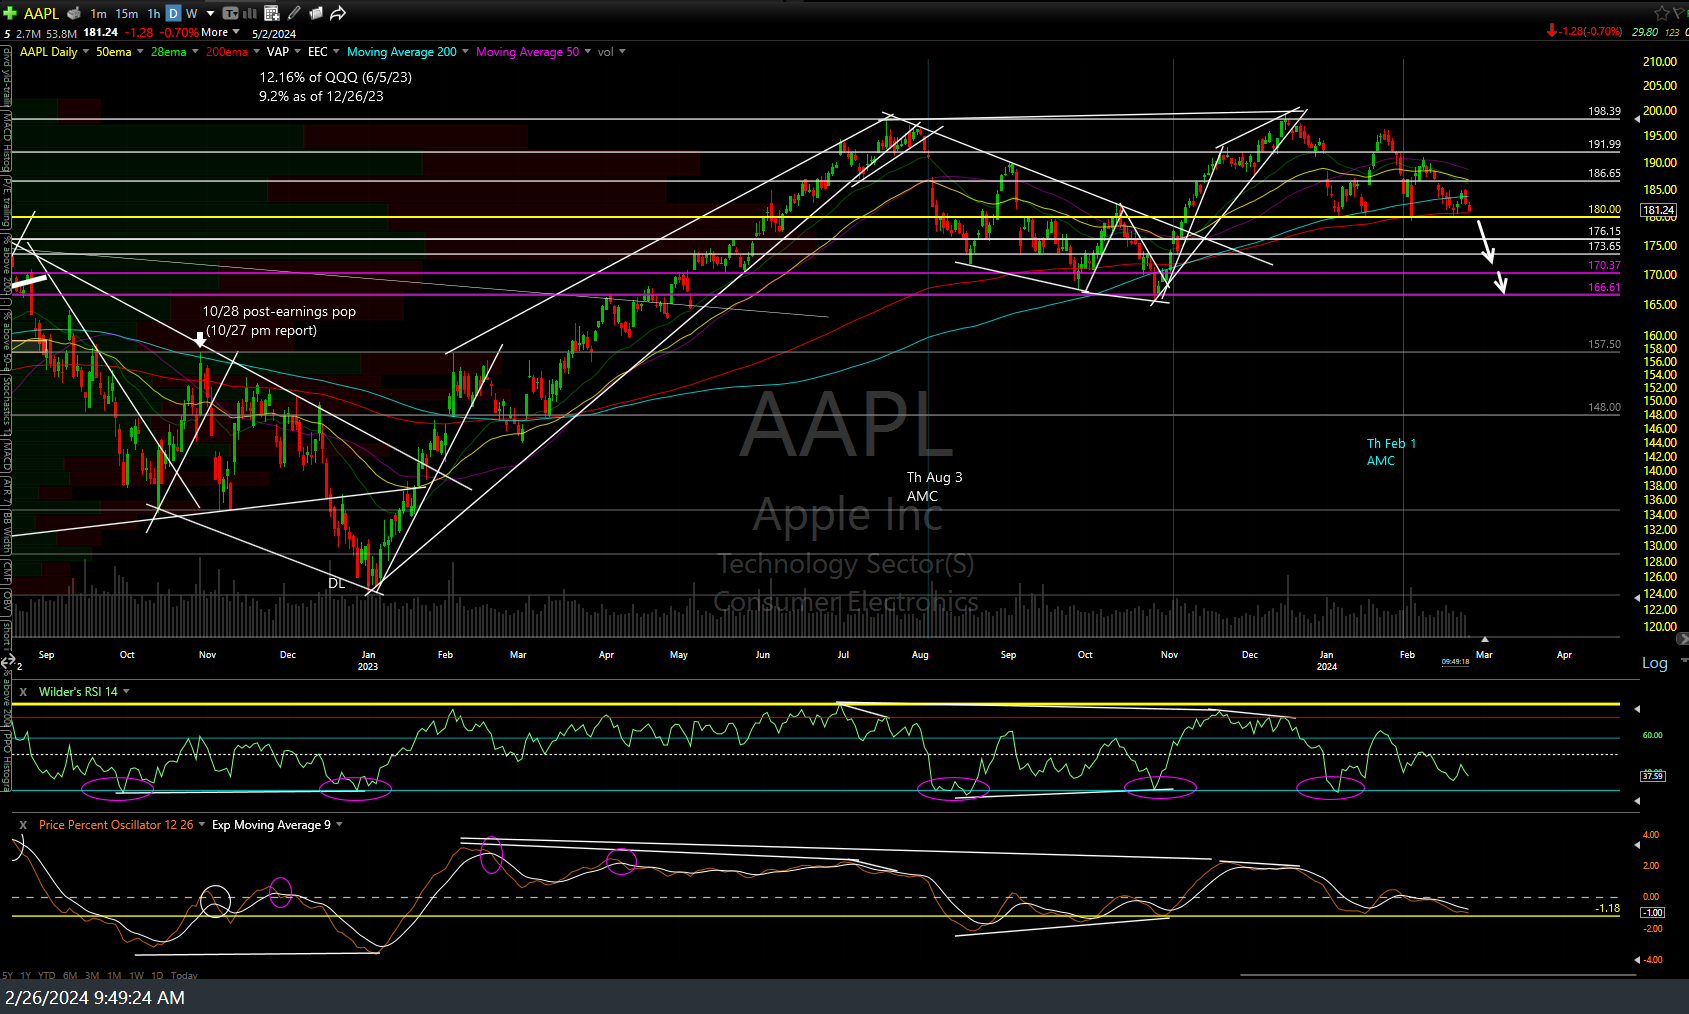
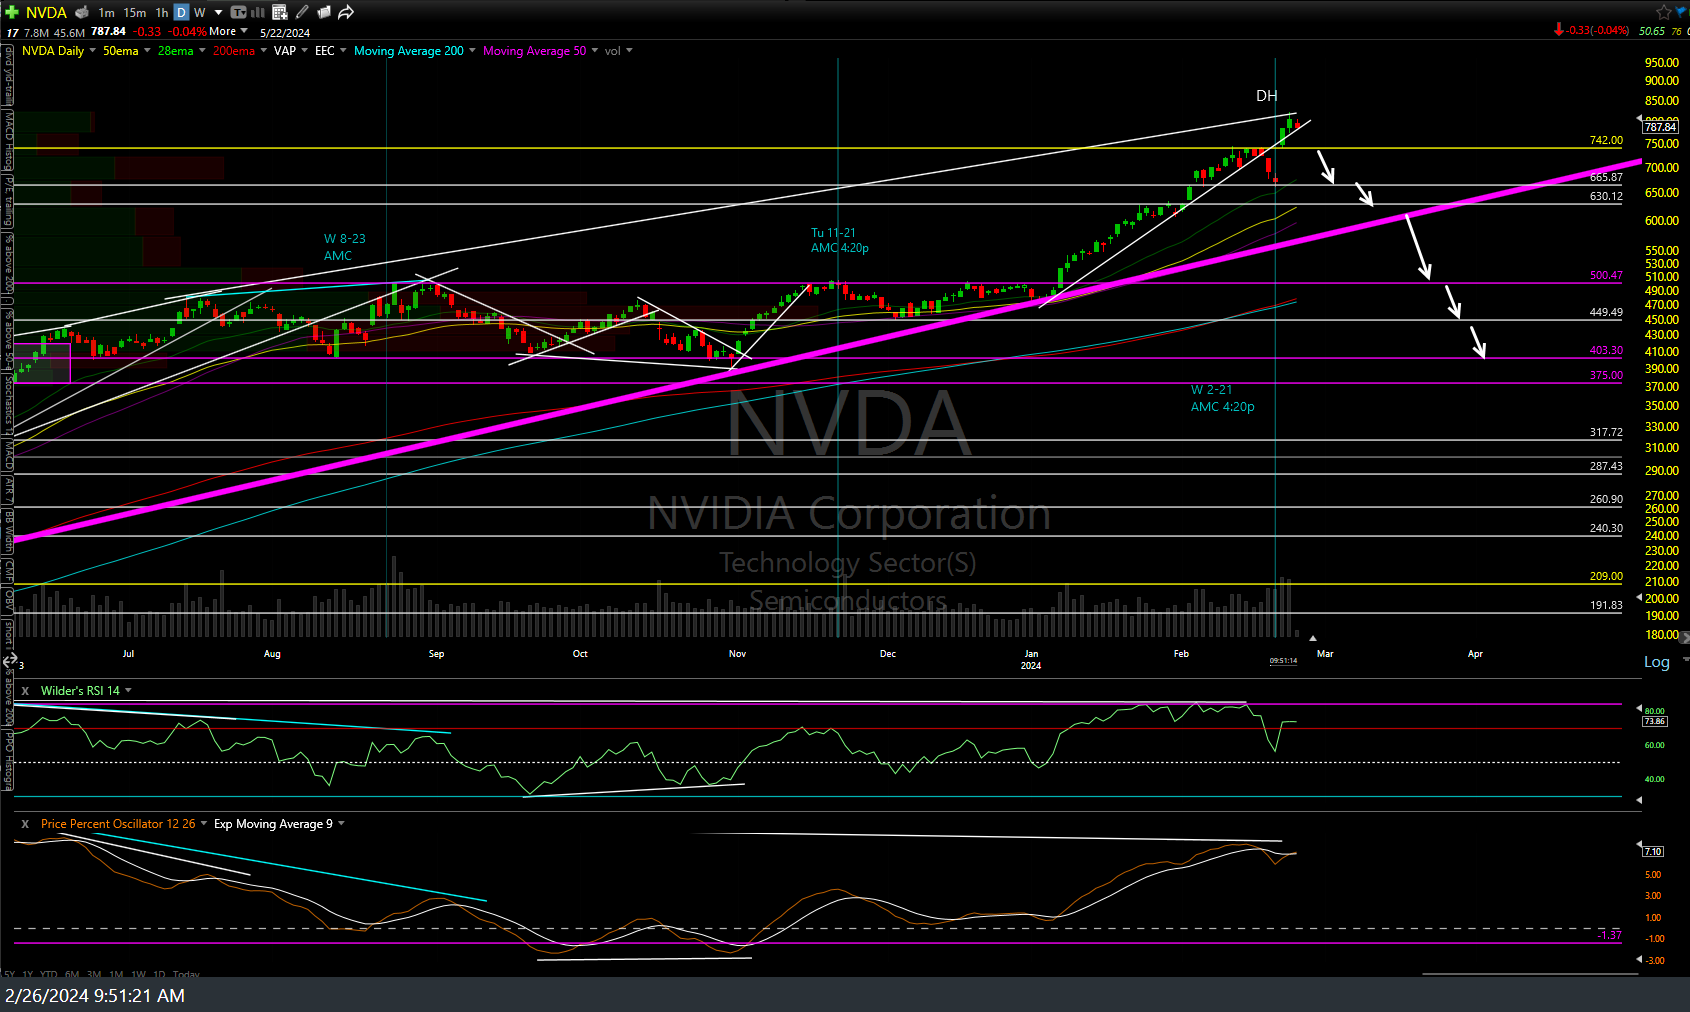
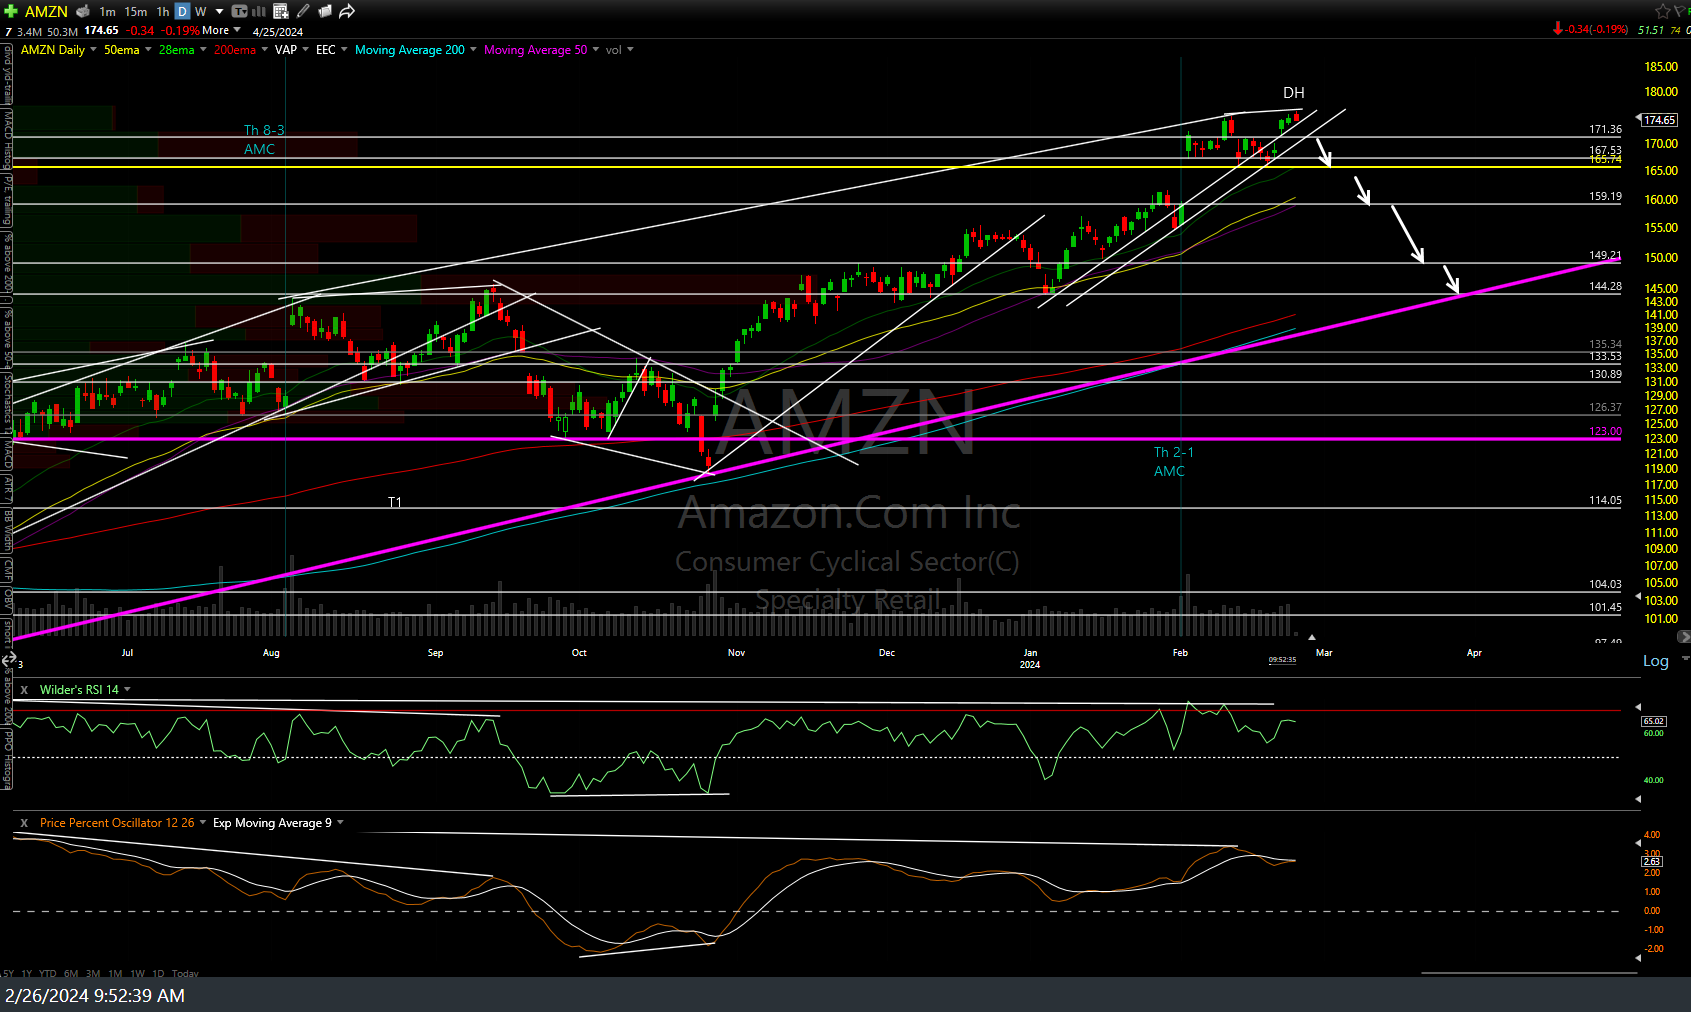
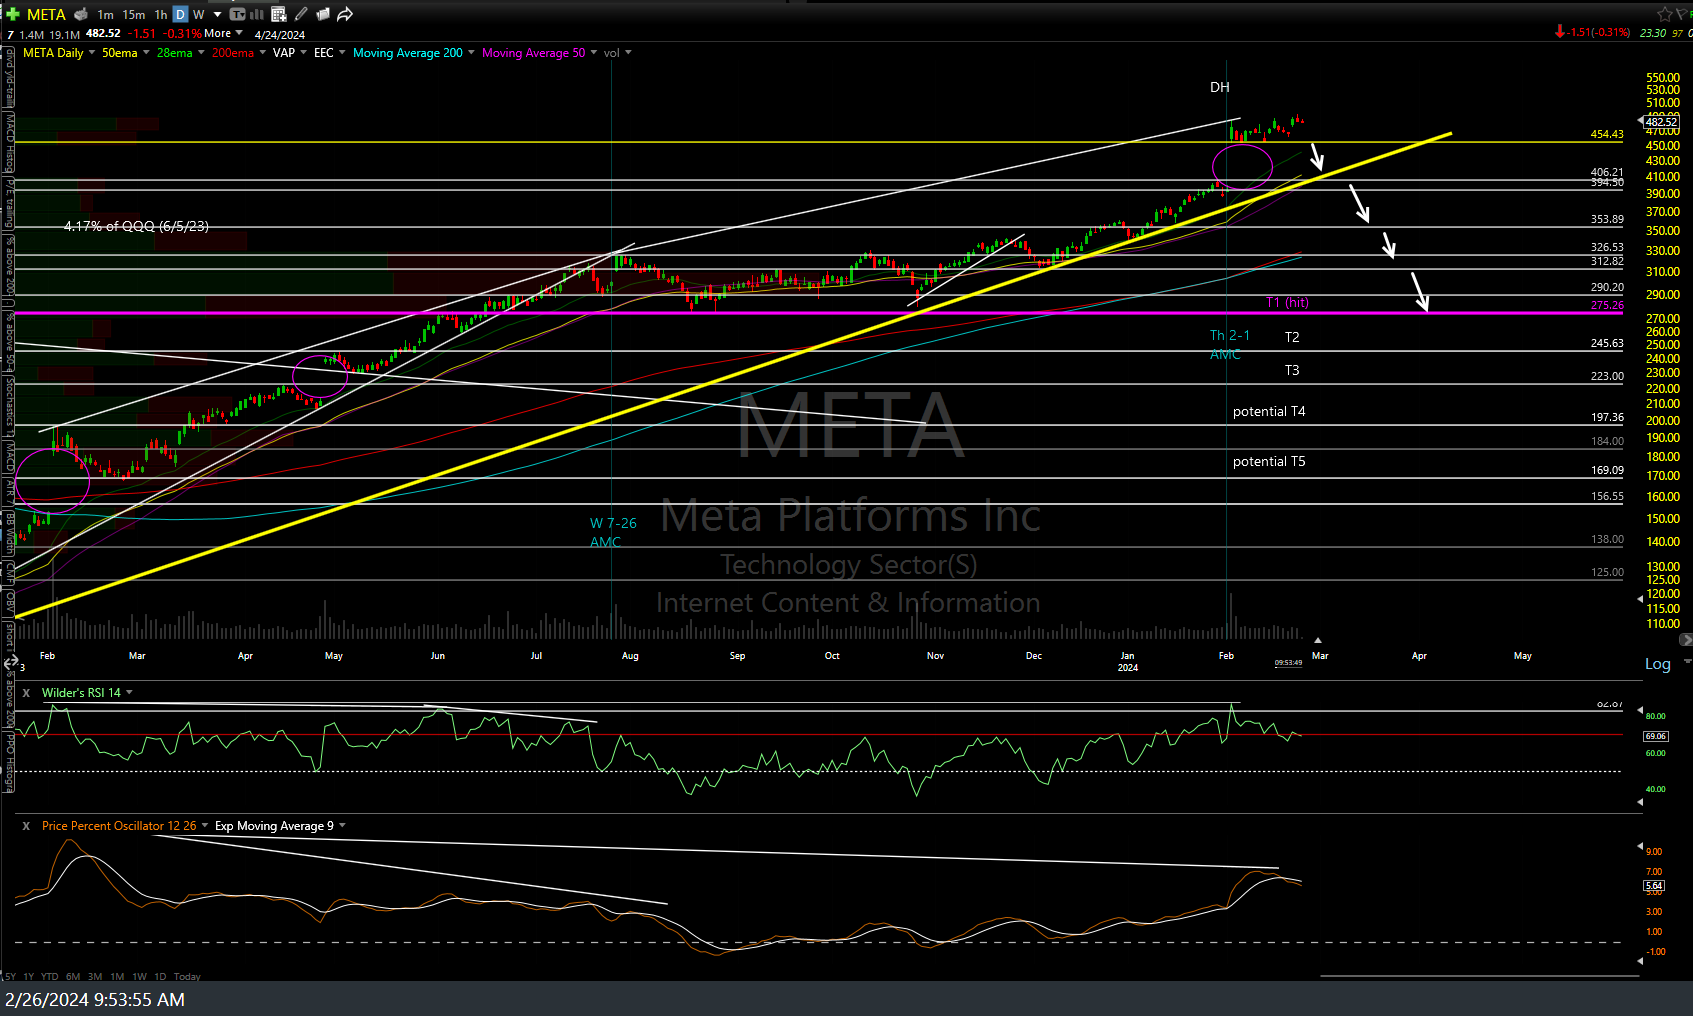
The daily charts below highlight some key support levels on some of the market-leading tech stocks (FKA as FANG, FAAMG, & then Magnificent 7) with the most significant nearby support levels (price and/or trendline support) in yellow with the same longer-term key support levels from last year still in purple.
The white lines also highlight nearby support & resistance levels that both swing & trend traders can use, depending on their outlook for the market and/or any of these particular stocks. i.e.: Those looking to short or add to shorts might wait for a break below any (or even better, all) of the nearby yellow support levels while those bullish & looking to go long could add to pullbacks to those support levels, with stops somewhat below.
Additionally, those looking to go long or short the tech-heavy Nasdaq 100 (/NQ, QQQ, etc..) could also use pullbacks or breaks of these support levels to help confirm (or refute) any buy or sell signals on the Nasdaq 100, such as a solid rejection off the primary uptrend line from the Oct ’24 lows (for short sellers) or a solid recovery & rally to close well above it. White arrows show my current preferred scenario & some initial targets, contingent on a solid rejection off the Oct ’24 uptrend line (which QQQ has backtesting for the 3rd consecutive trading session following last week’s breakdown below it) and a the 4 criteria from two weeks ago; Breakdowns below the Tuesday Feb 13th lows on SPY, QQQ, META, & AMZN (and of course, breakdowns of the first support levels shown at the initial arrows).


