
There are currently solid positive (aka- bullish) divergences on the 60-minute charts of both /ES (S&P 500 futures) & /NQ (Nasdaq 100 futures) which are a potential catalyst for a rally…or…the next leg down, if these divergences are taken out soon.
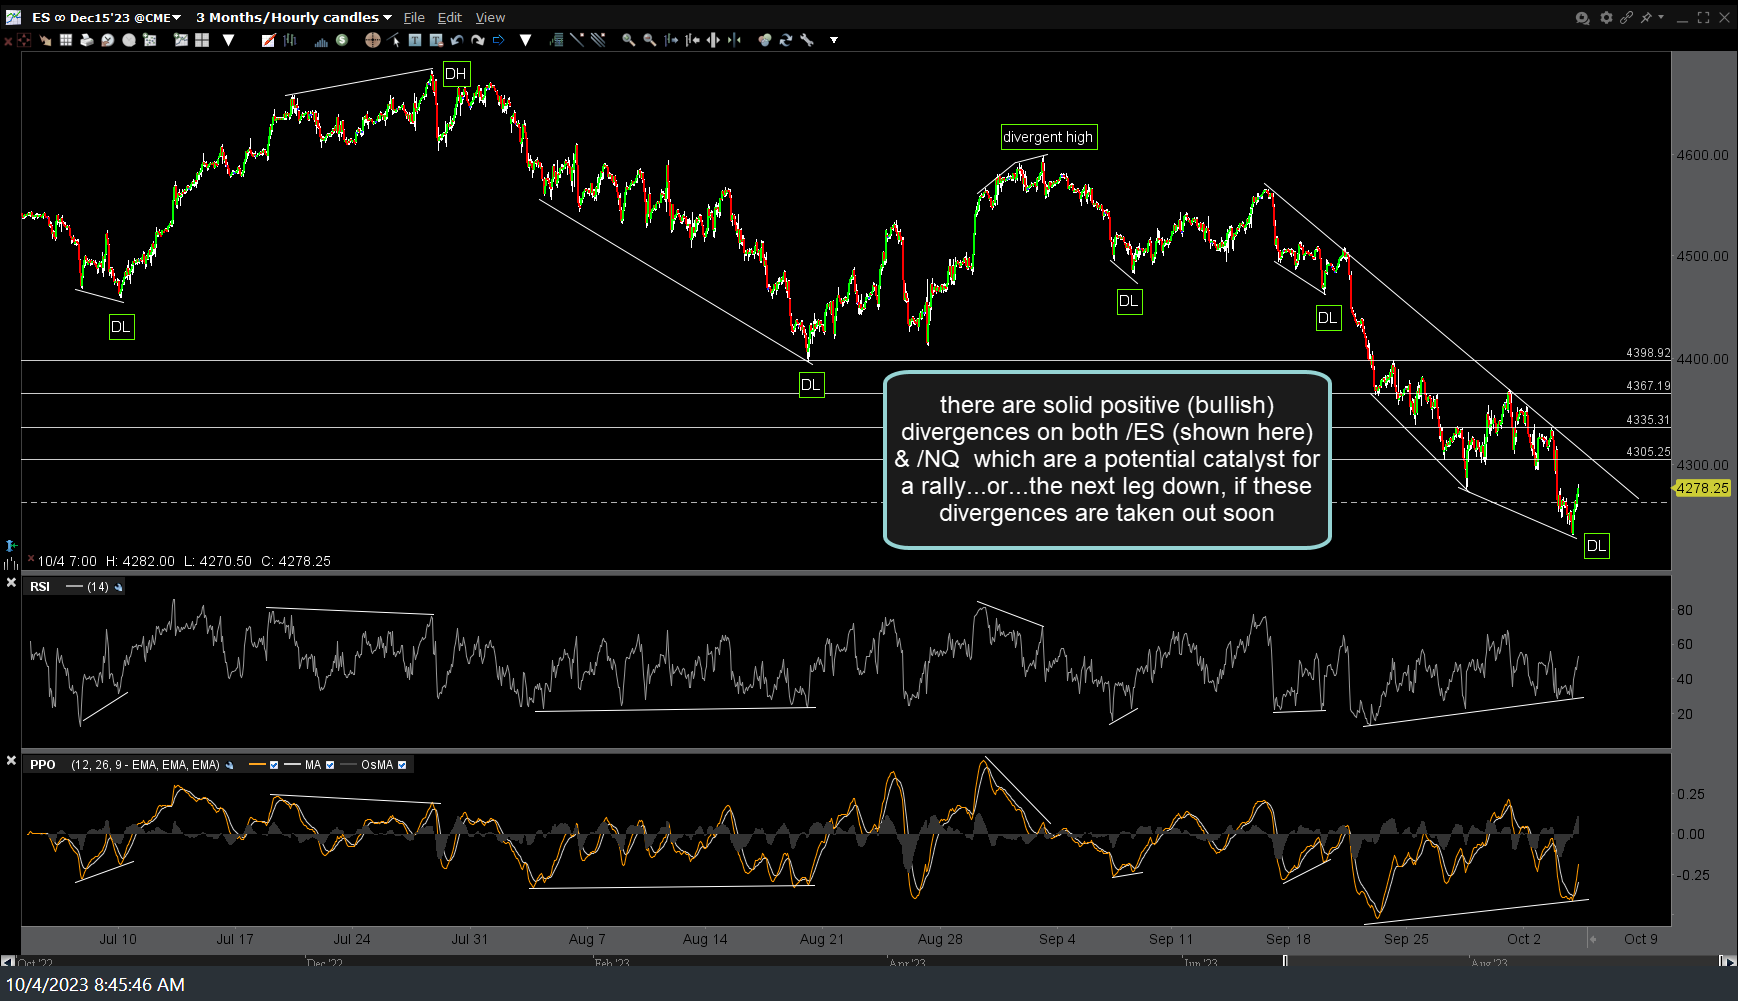
ES 60m Oct 4th
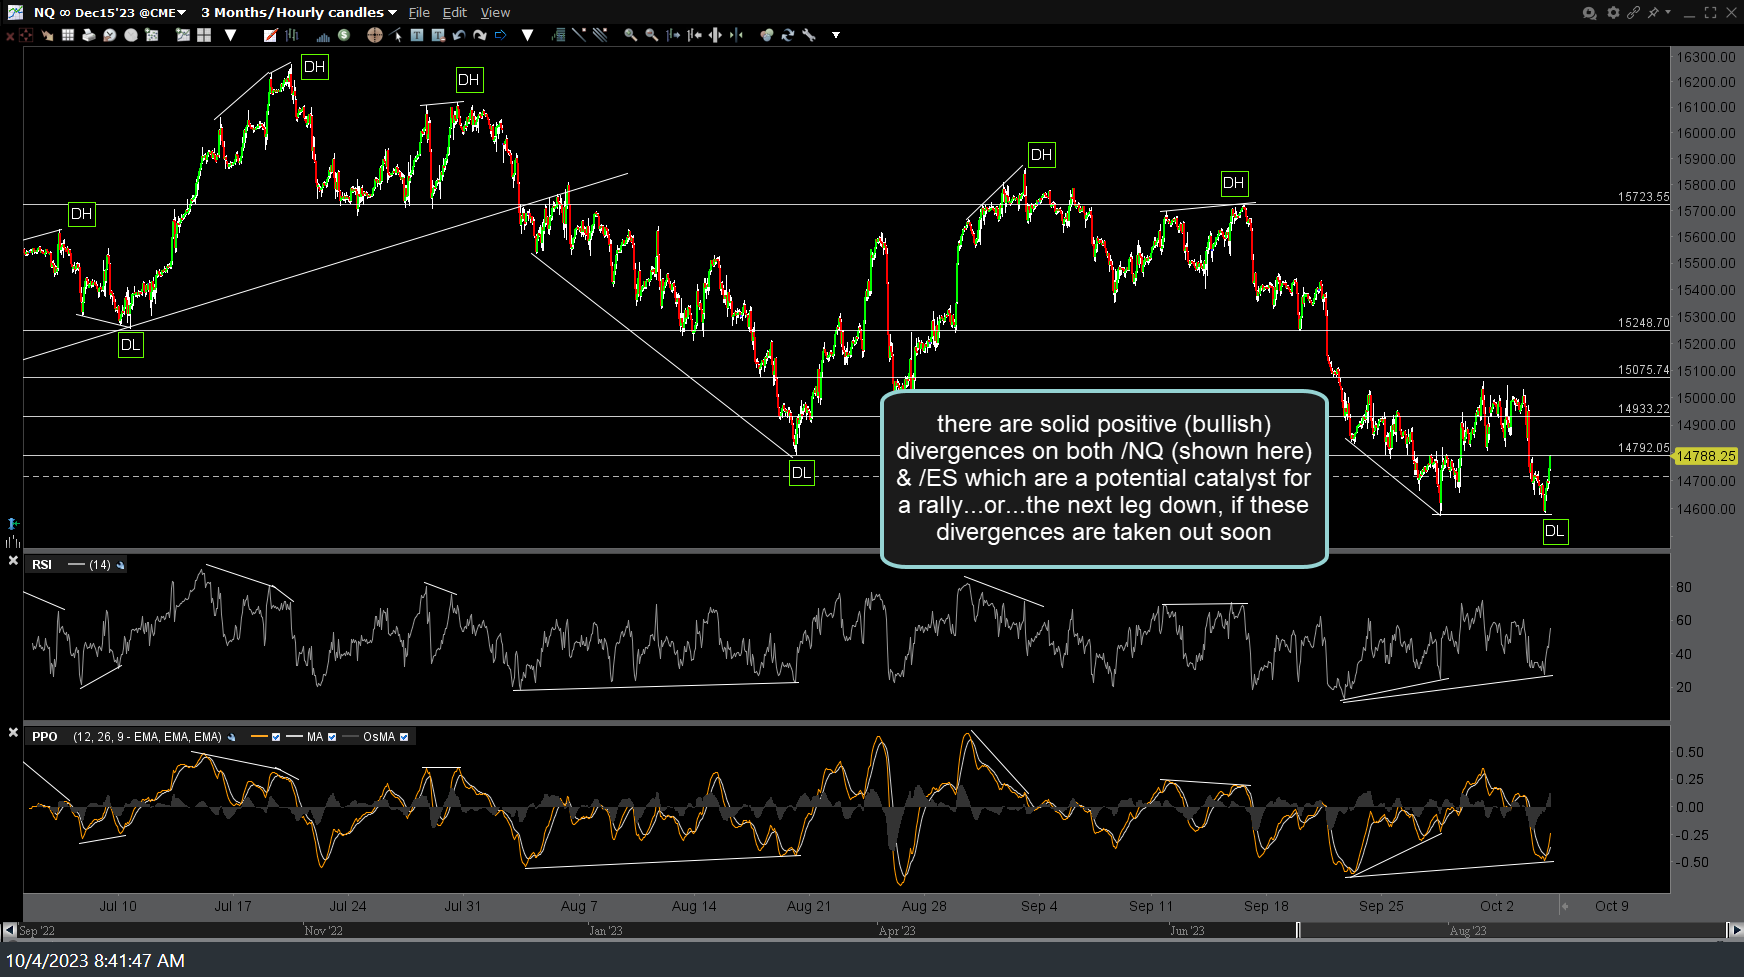
NQ 60m Oct 4th
There are still plenty of yellow flags out there that have the potential to take the indexes down much lower, potentially “negating” these divergences by taking out the previous reaction lows on the momentum indicators (RSI, PPO, MACD, etc.). While I can’t give specific investing or trading advice, I can say that it would seem prudent for those already short to hold off on adding much more short exposure until & unless these divergences & some of the key support levels just below on the indexes & Magnificent 7 that were highlighted in recent videos are clearly taken out.
Those bullish & expecting a decent bounce and/or new highs in the market soon could also make a case a to go long with a stop below the recent lows and/or if & when the 60-minute divergences are taken out. Nothing has changed in my outlook since yesterday’s updates although solid breakouts above the initial resistance levels marked on the charts above (and each additional resistance level above those) certainly have the potential to change the near-term & potentially the intermediate-term trajectory (trend) of the market.
Bottom line: I remain near-term & intermediate-term bearish & short, suspecting these divergence will not play out for much more than a relatively small (~3-4%) & brief (< 1-week) counter-trend rally, at best, but ready to adjust accordingly, depending on how the charts develop going forward.