
Despite my expectation for both near-term & intermediate-term downside in the stock market, I would be remiss not to point out that this divergent low on the 60-minute chart of QQQ (as well as SPY, /ES, & /NQ) has the potential to be the catalyst for a rally & backtest of the primary uptrend line (still my alternative scenario… dotted arrows) although my preferred scenario remains more downside without a backtest (solid arrows). Previous (Thursday’s) & updated 60-minute charts below.

QQQ 60m Aug 3rd
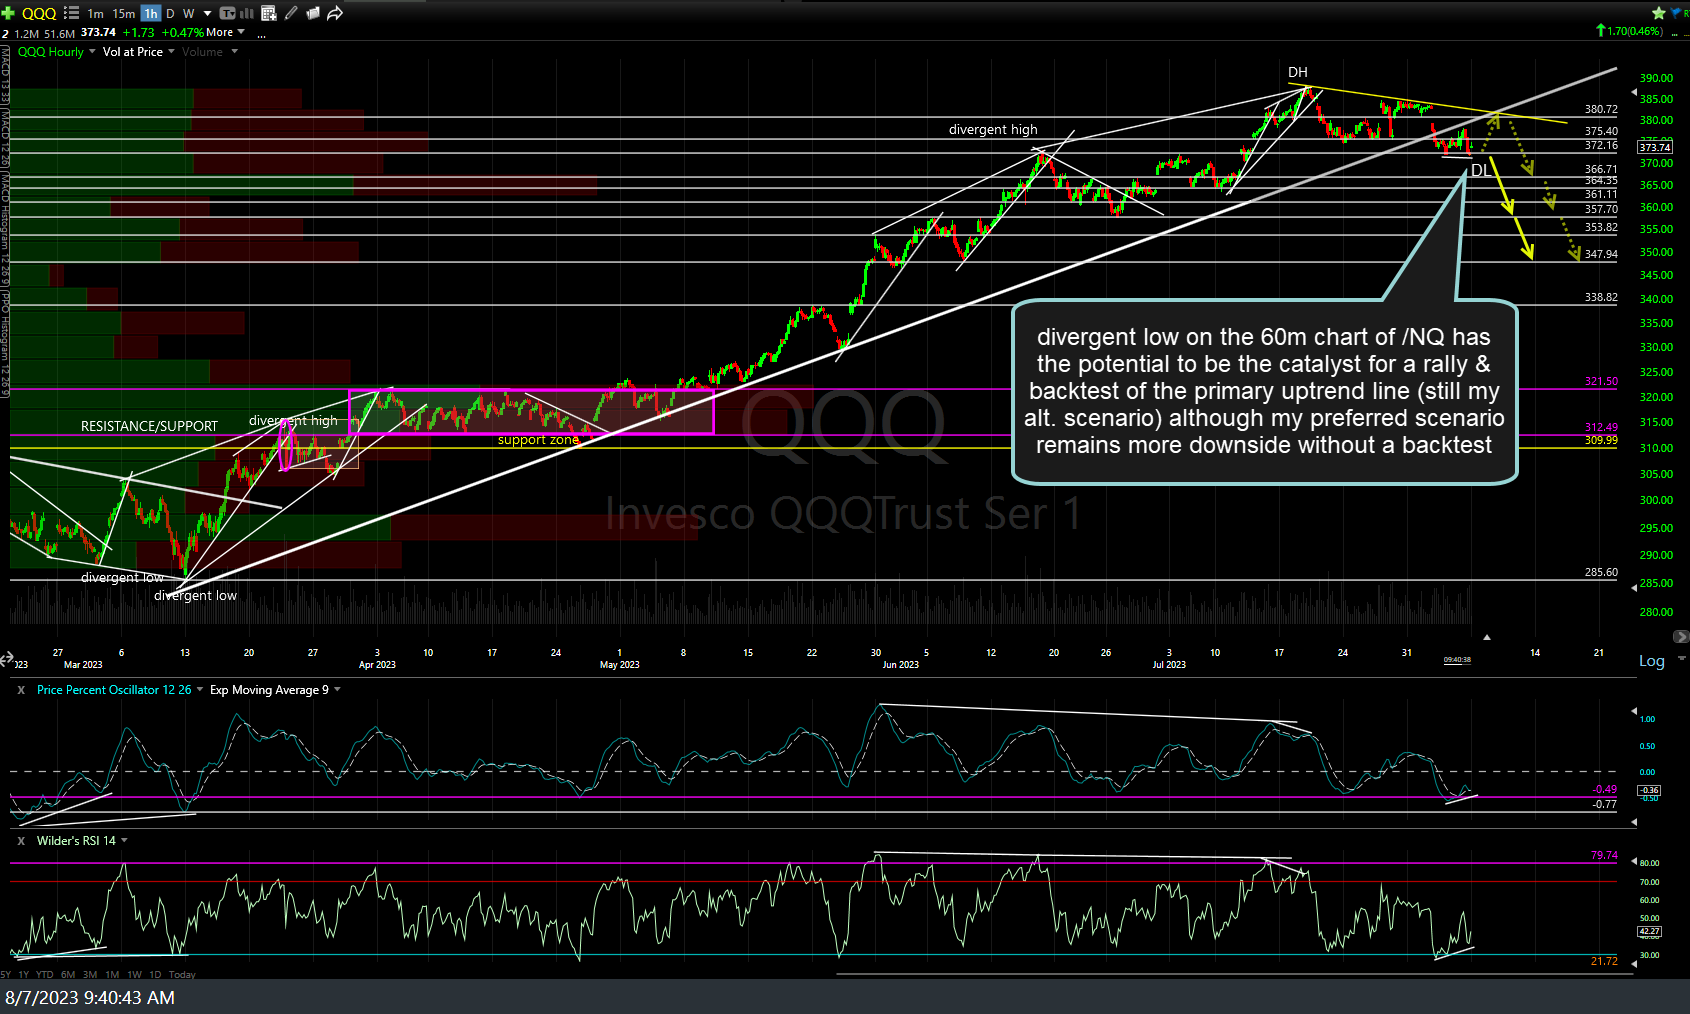
QQQ 60m Aug 7th
60-minute charts of /NQ (Nasdaq 100 futures) & /ES (S&P 500 futures) for reference below. The onus is on the bulls/dip buyers to step in here & run on this divergent low at support although I suspect this textbook bullish setup with soon fail. Regardless whether we rally first or not, a solid break below 4496 will trigger the next sell signal on /ES.
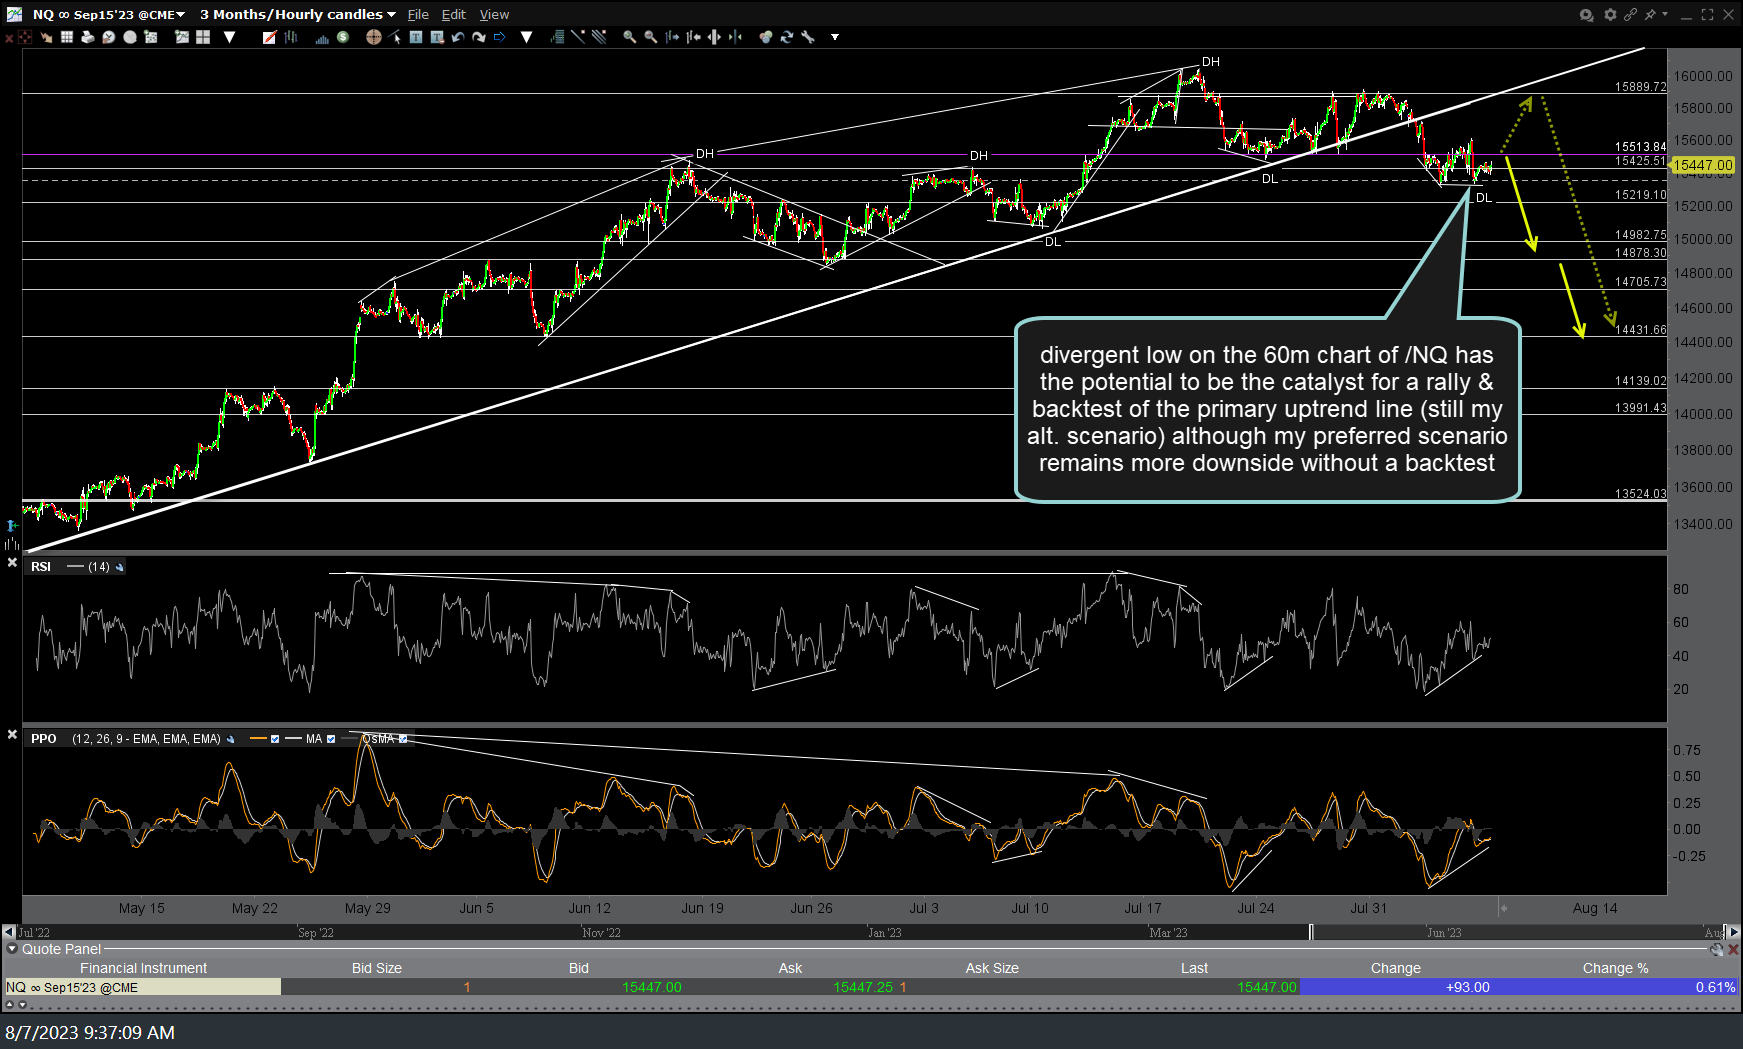
NQ 60m Aug 7th
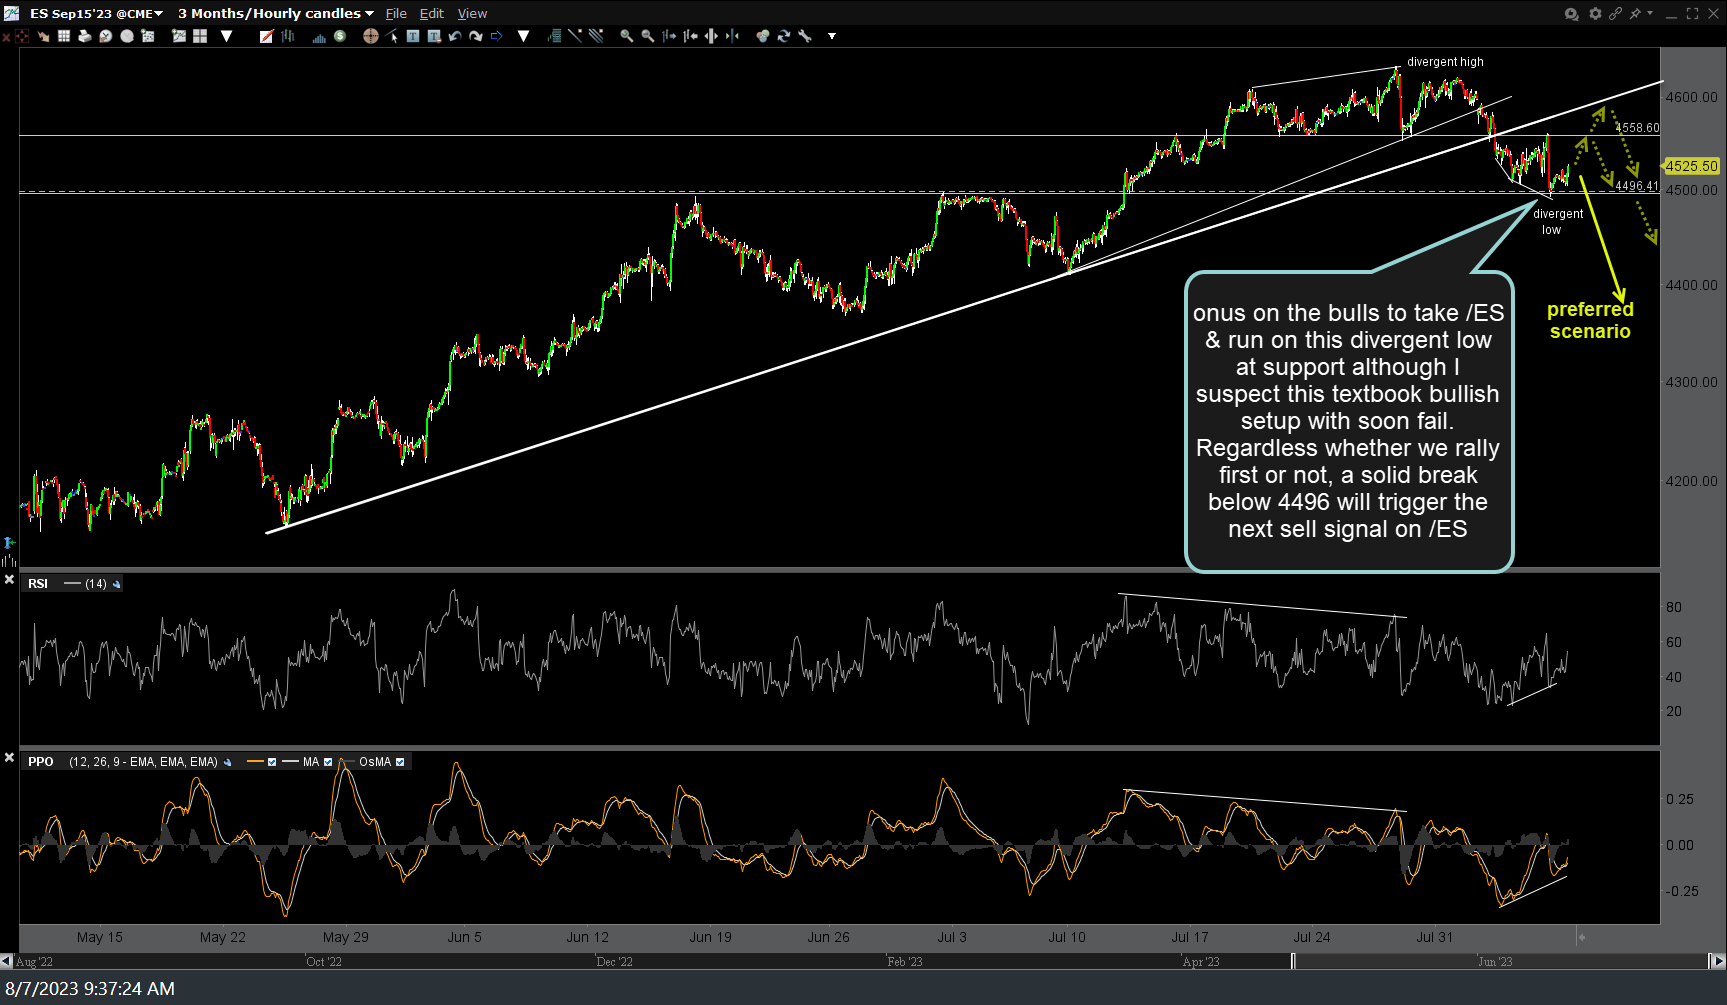
ES 60m Aug 7th
Bottom line: Basically, divergent lows on the 60-minute charts have been the catalyst for strong rallies for the past year & pretty much just about all points in time for that matter. While in a vacuum, I might say the odds are very good that these 60-minute divergences across the board on both the S&P 500 & Nasdaq 100 futures & tracking ETFs would be follow by a double-digit rally lasting weeks or months, taking all of the recent technical developments & current posture of the charts into consideration, I still give favorable odds that these divergences will soon be taken out with what could be a very sharp & swift drop in the coming days to weeks.
Should the markets hold support, keep these divergences intact & begin to rally, I will communicate my thoughts as to whether or not I think the trendline backtest scenario has become the more likely one. As for now, watching for the next support levels to give way on the indexes as well as how the big market-leading tech stocks trade, among other things.