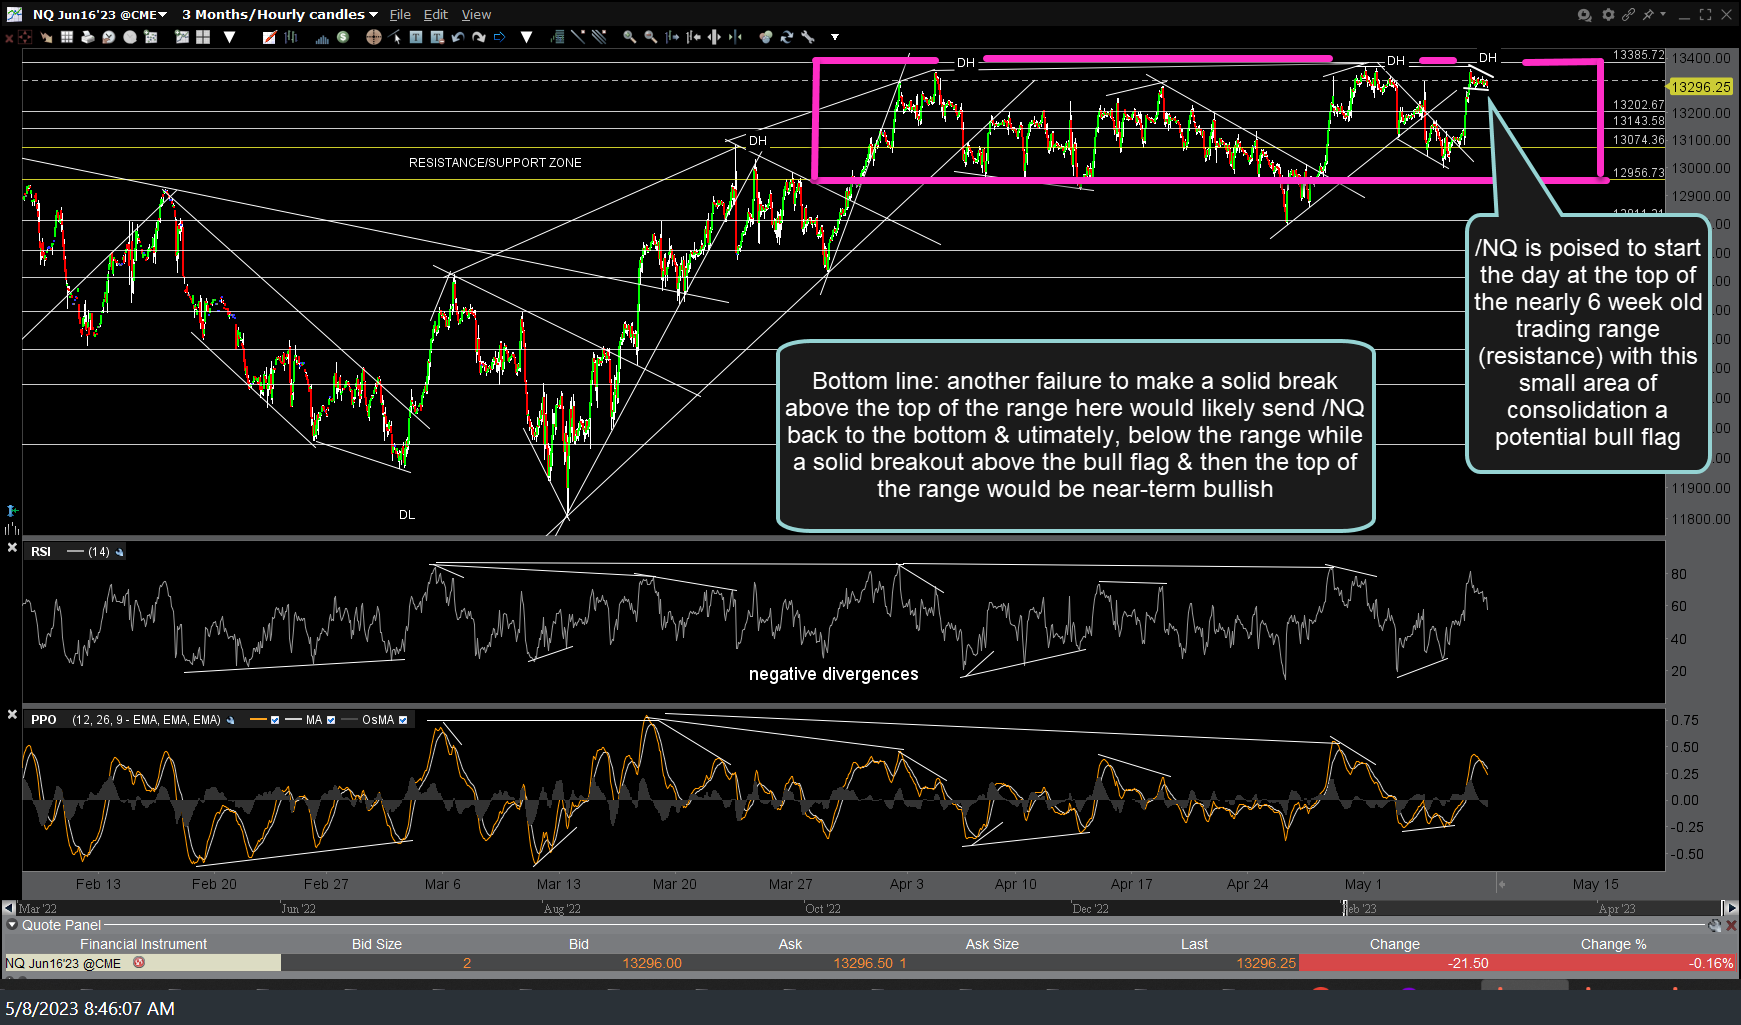
Another groundhog day for the Nasdaq 100 with /NQ (futures) once again at the top of the nearly 6-week old sideways trading range. As with previous rallied to the top of the range (resistance), this provides another objective short entry with stops somewhat above* while a solid & sustained breakout above both the bull flag & the top of the range just above would be bullish until & unless that breakout fails.
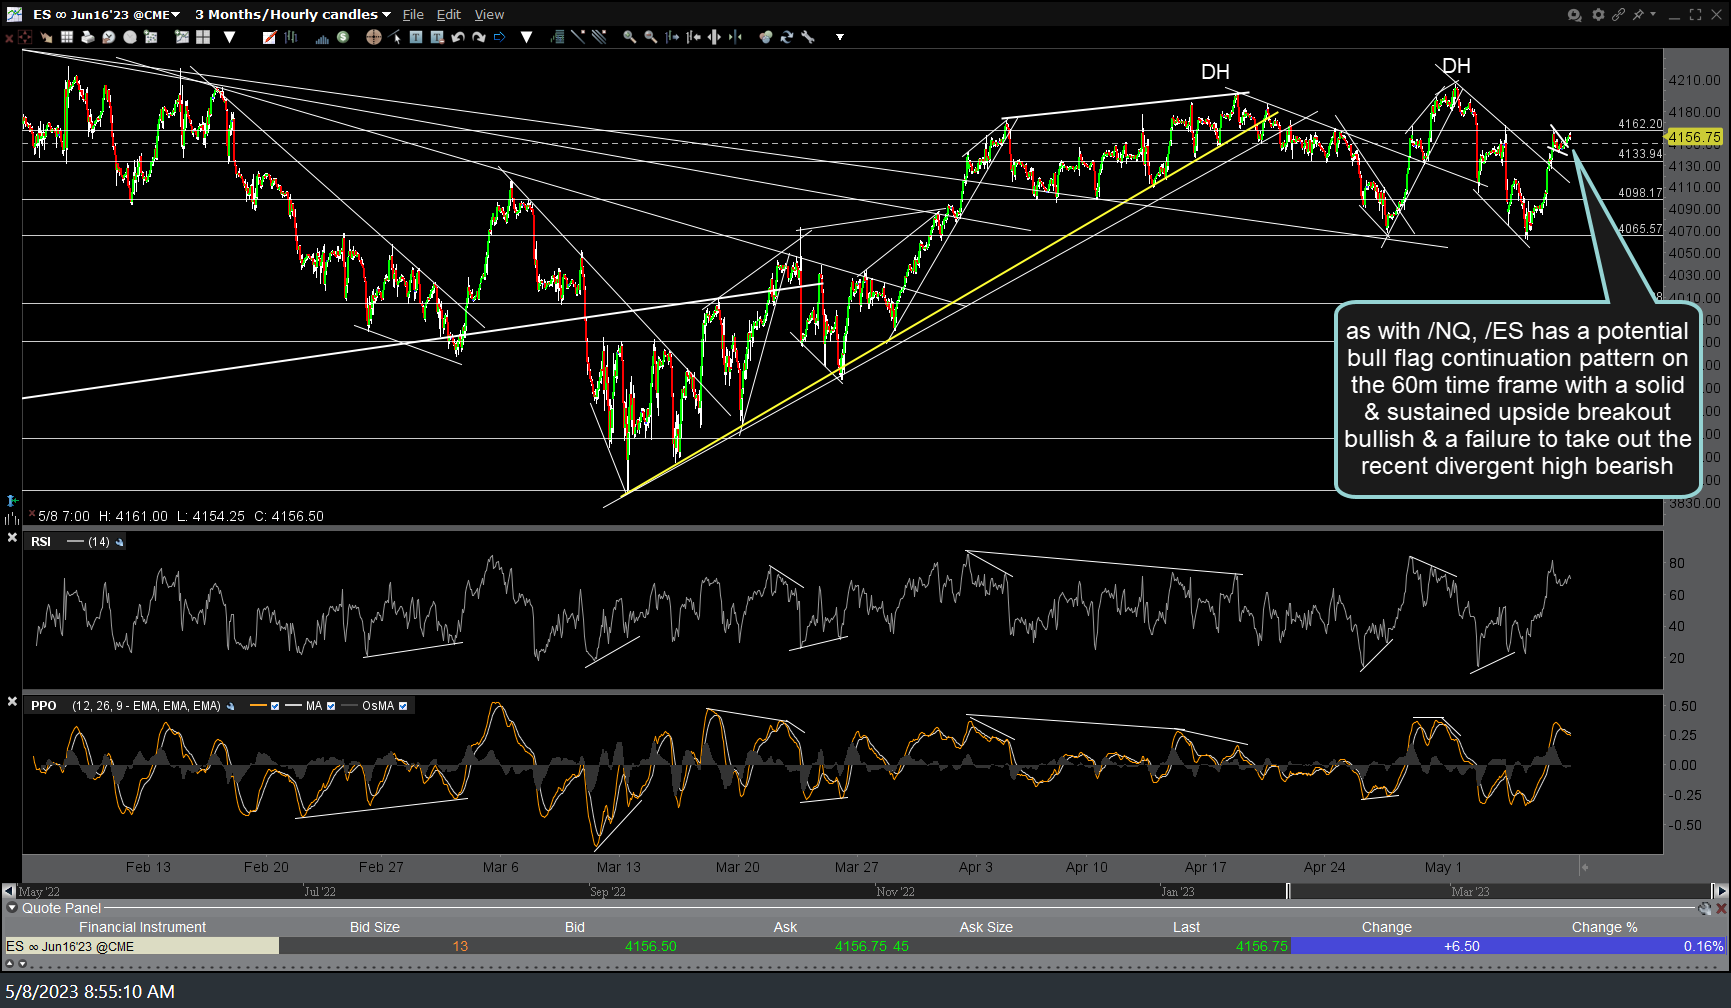
As with /NQ, /ES (S&P 500 futures) also has a potential bull flag continuation pattern on the 60-minute time frame with a solid & sustained upside breakout bullish & a failure to take out the recent divergent high bearish. Sooner than later the stock market is going to pick the direction of the next trend & with both the FOMC meeting as well as all the big market-leading tech stocks’ earnings now out of the way, I would put very high odds on that direction finally starting to become apparent this week.
*Regarding price targets for a short here at the top of the range on the Nasdaq 100, stops “somewhat” above the recent highs would be relative to one’s preferred price targets. For those only looking for another move down to the bottom of the range which is about 3-3.5%, a relatively tight stop of 1.5-2% would make sense. For those looking for a likely downside break below the range & a drop to my next longer-term swing/trend target about 30% below current levels, a stop of around 10% or so would be inline with an attractive R/R of 3:1.
If gaming a breakout above the bull flags (you want to see solid breaks above both /NQ & /ES) and/or the top of the trading range on at least /NQ, if not /ES as well, then the measured targets for the flag patterns (length of their flagpoles added to the lowest part of the flags) would be the minimum target with the possibility for a considerable higher move if the breakout above the trading ranges stick. Of course, a drop back below the flags following any breakout would mean the breakouts failed so that would be an objective stop level.


