
SPY (S&P 500 ETF) has fallen to the primary uptrend line off the mid-October lows (support) where at tradable bounce is likely. 60-minute chart below.
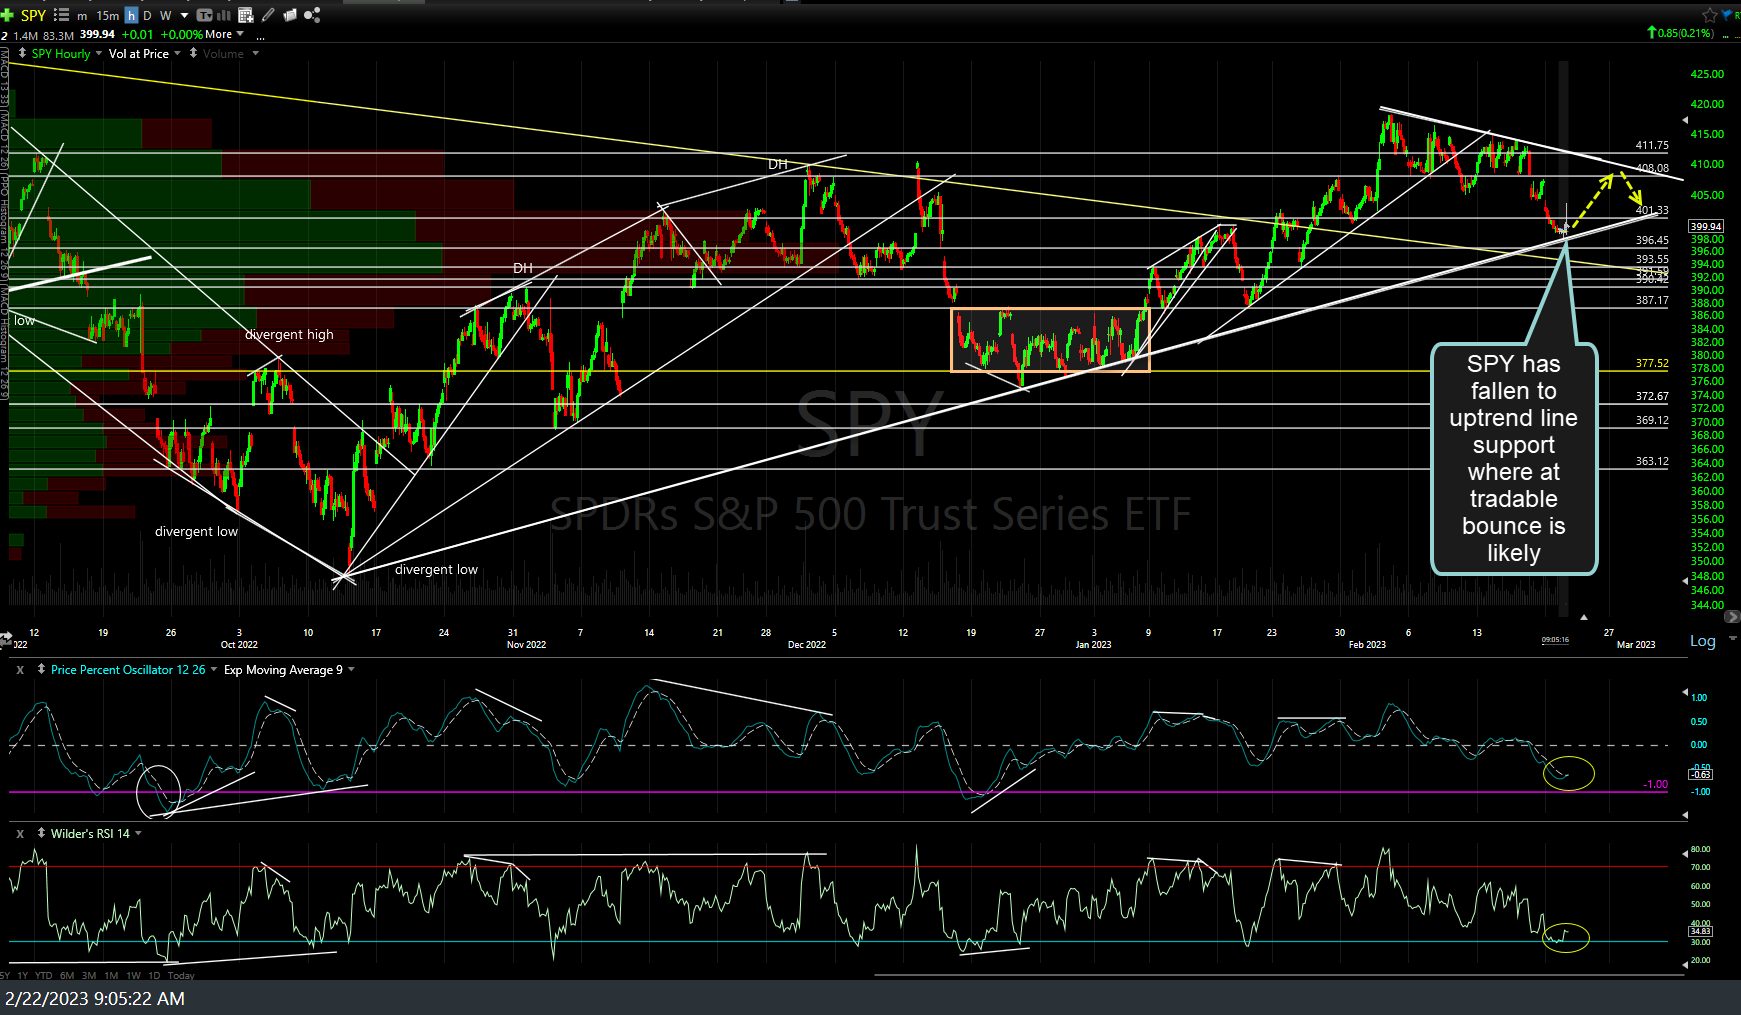
SPY 60m Feb 22nd
QQQ (Nasdaq 100 ETF) is still testing the 294ish support it closed on yesterday while also smack between the 200-day EMA & SMA. Daily chart below.
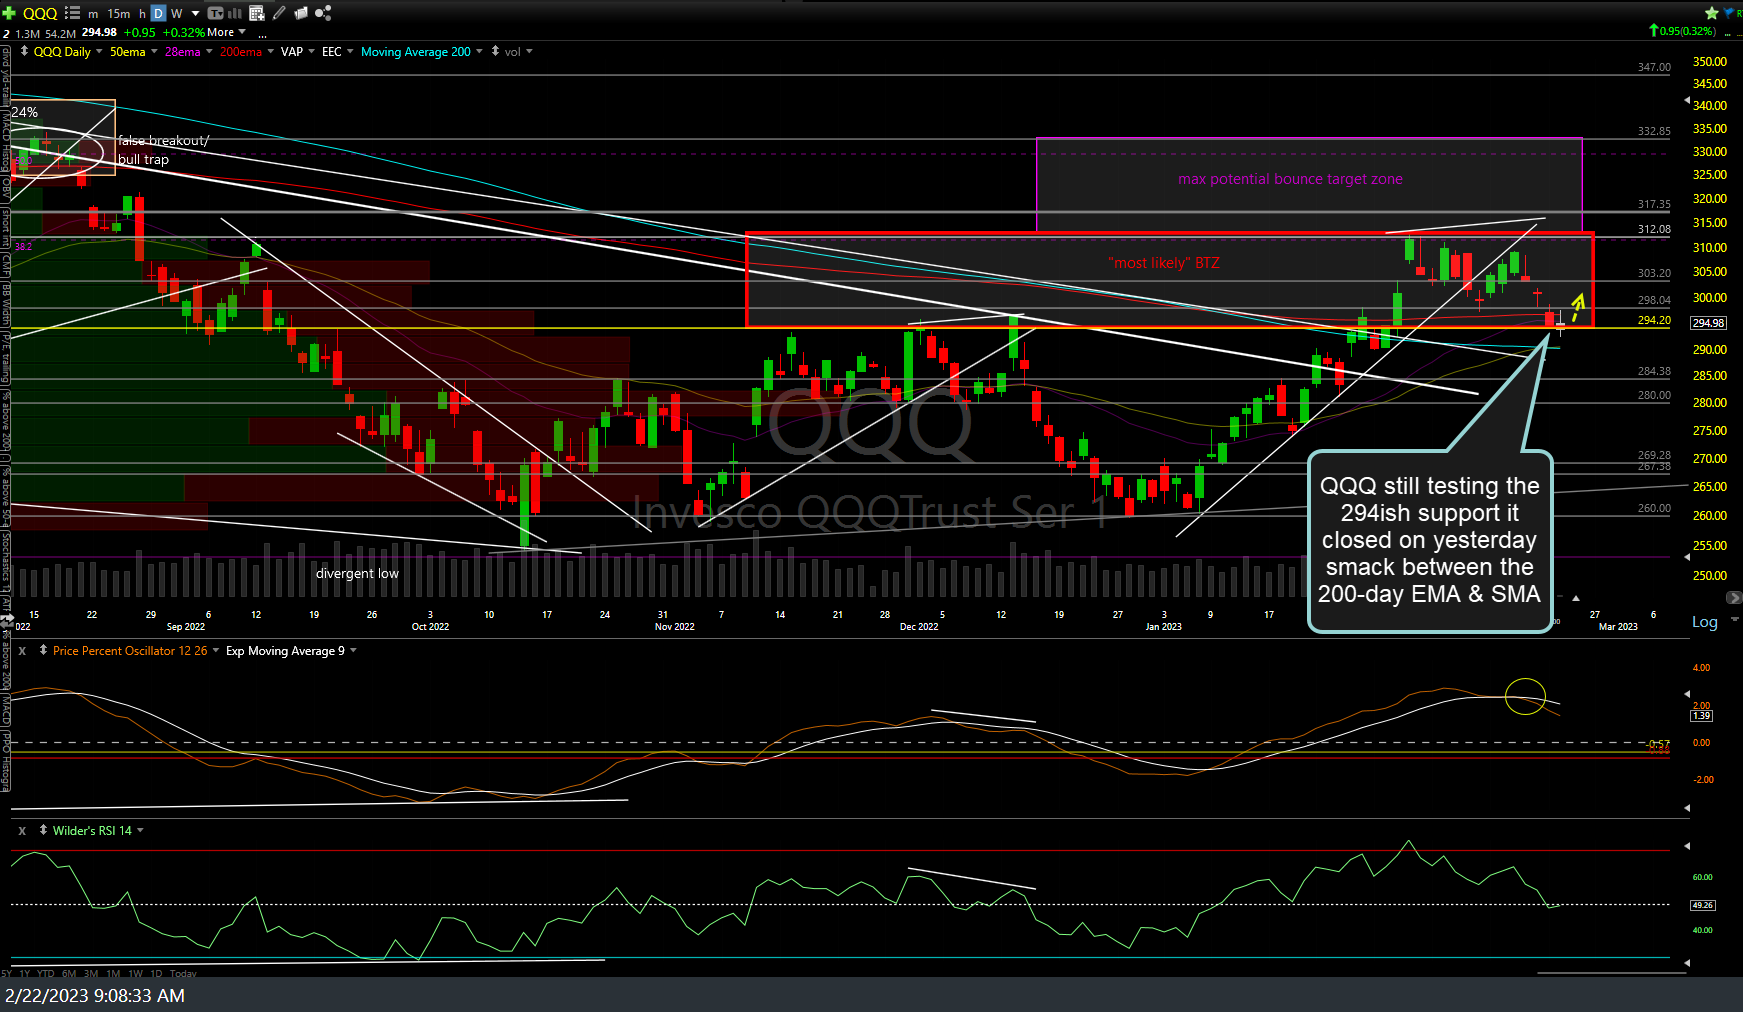
QQQ daily Feb 22nd
Zooming down to the 60-minute chart of /NQ (Nasdaq 100 futures), a solid break above ths bullish falling wedge would likely spark a near-term rally.
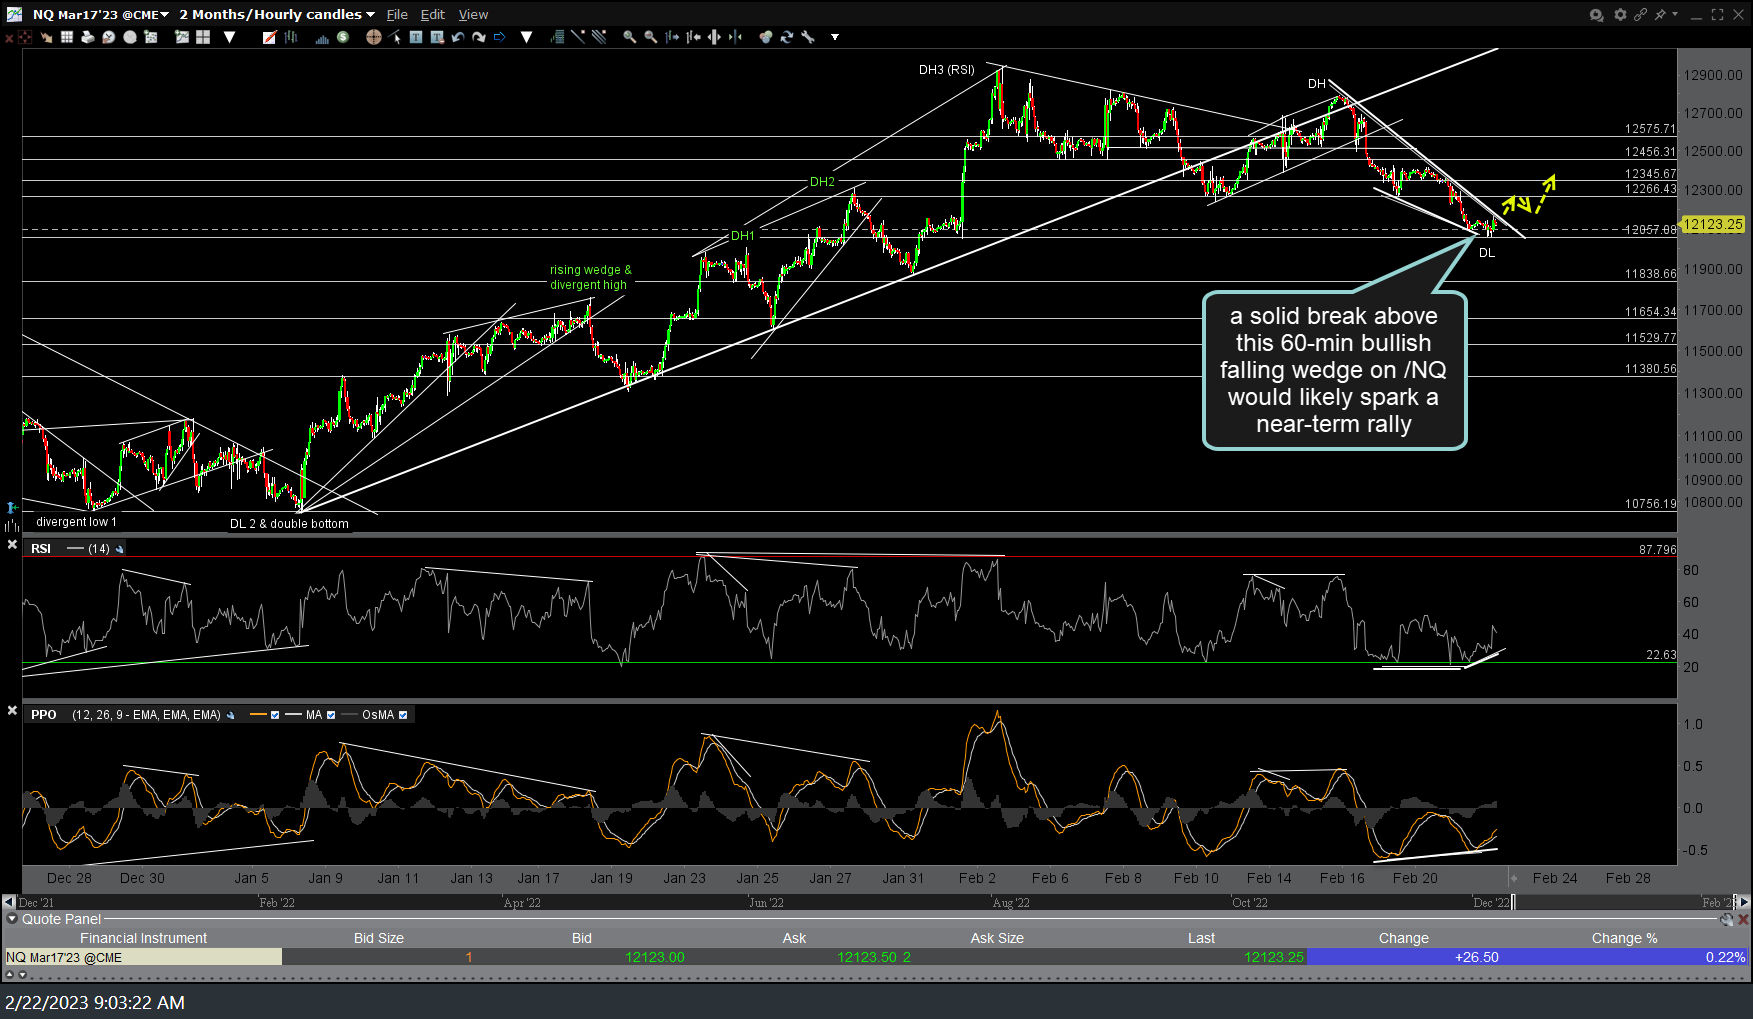
NQ 60m Feb 22nd
[/fusion_text][/fusion_builder_column][/fusion_builder_row][/fusion_builder_container]