
Early-session technical analysis with some key levels & developments to watch for at this time.
Note: Video is still processing on YouTube’s servers so refresh page until it is available for playback. Initial playback quality will be standard resolution but HD playback should be available shortly but will require refreshing the page. I wanted to get the 2 charts below out to you asap as we are at the level where I believe the first tradable bounce following the post-opening gap fade is likely to occur.
This updated 10-minute chart has the minor trendline from the previous 10-minute chart posted earlier today slightly tweaked to align with the new pullback target added during the recording of this video with my “micro-analysis” or short-term active trading scenario shown by the yellow arrows (reversing from short to long here).
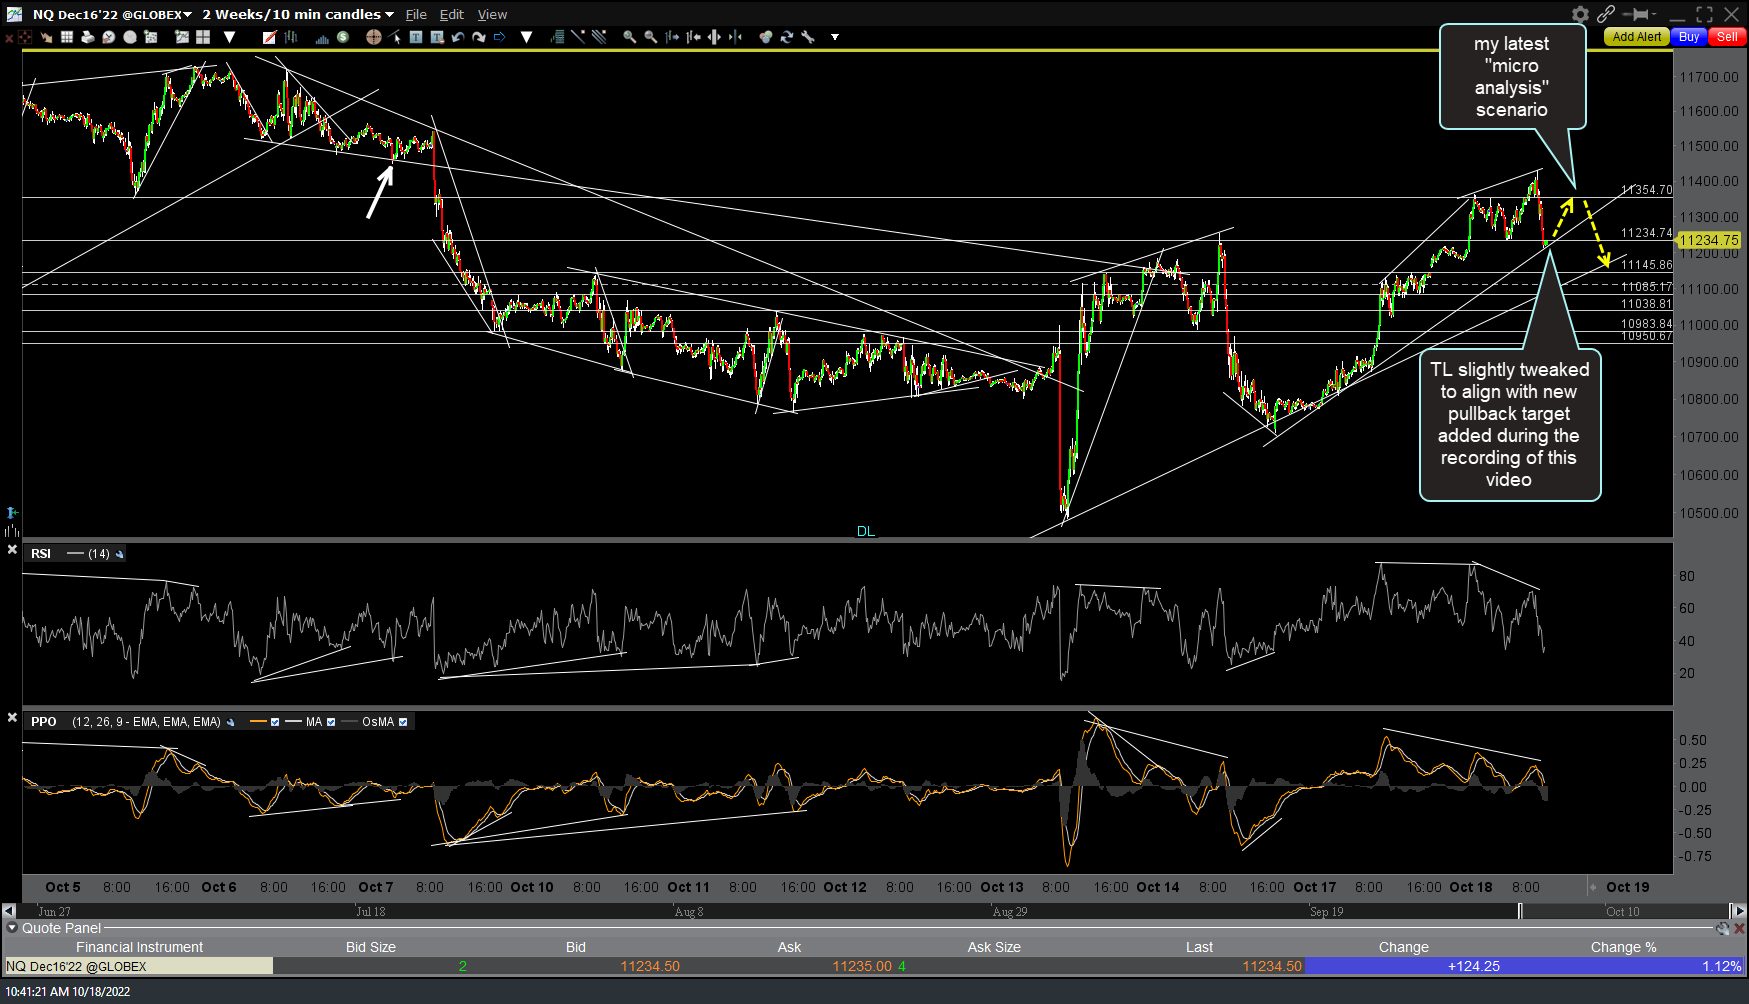
NQ 10m 2 Oct 18th
QQQ opening fade to pullback to my 271.90 former resistance, now support level where a tradable bounce is likely (as covered in the video). Updated 60-minute chart below.
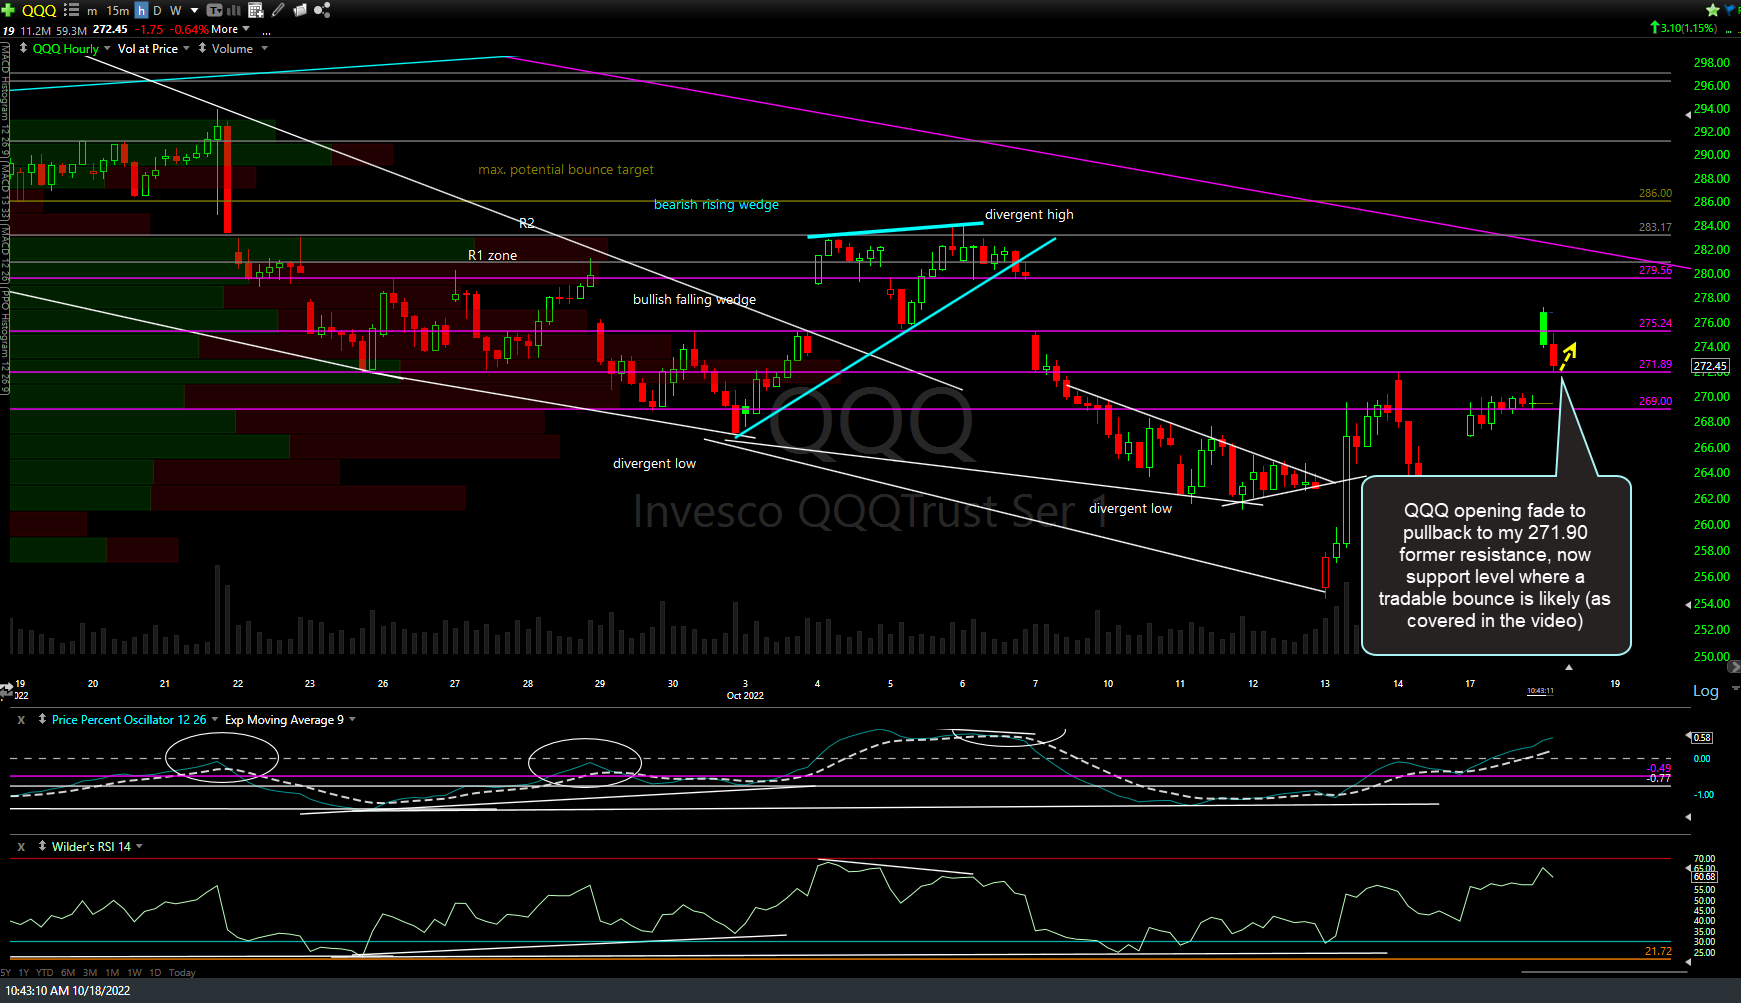
QQQ 60m Oct 18th