
With /NQ (Nasdaq 100 futures) at the 15536 support with positive divergences, active traders could opt to cover shorts & reverse to long for a bounce trade here while the next sell signal will come on a solid break below today’s lows on both /NQ & /ES (at trendline support). 60-minute chart below.
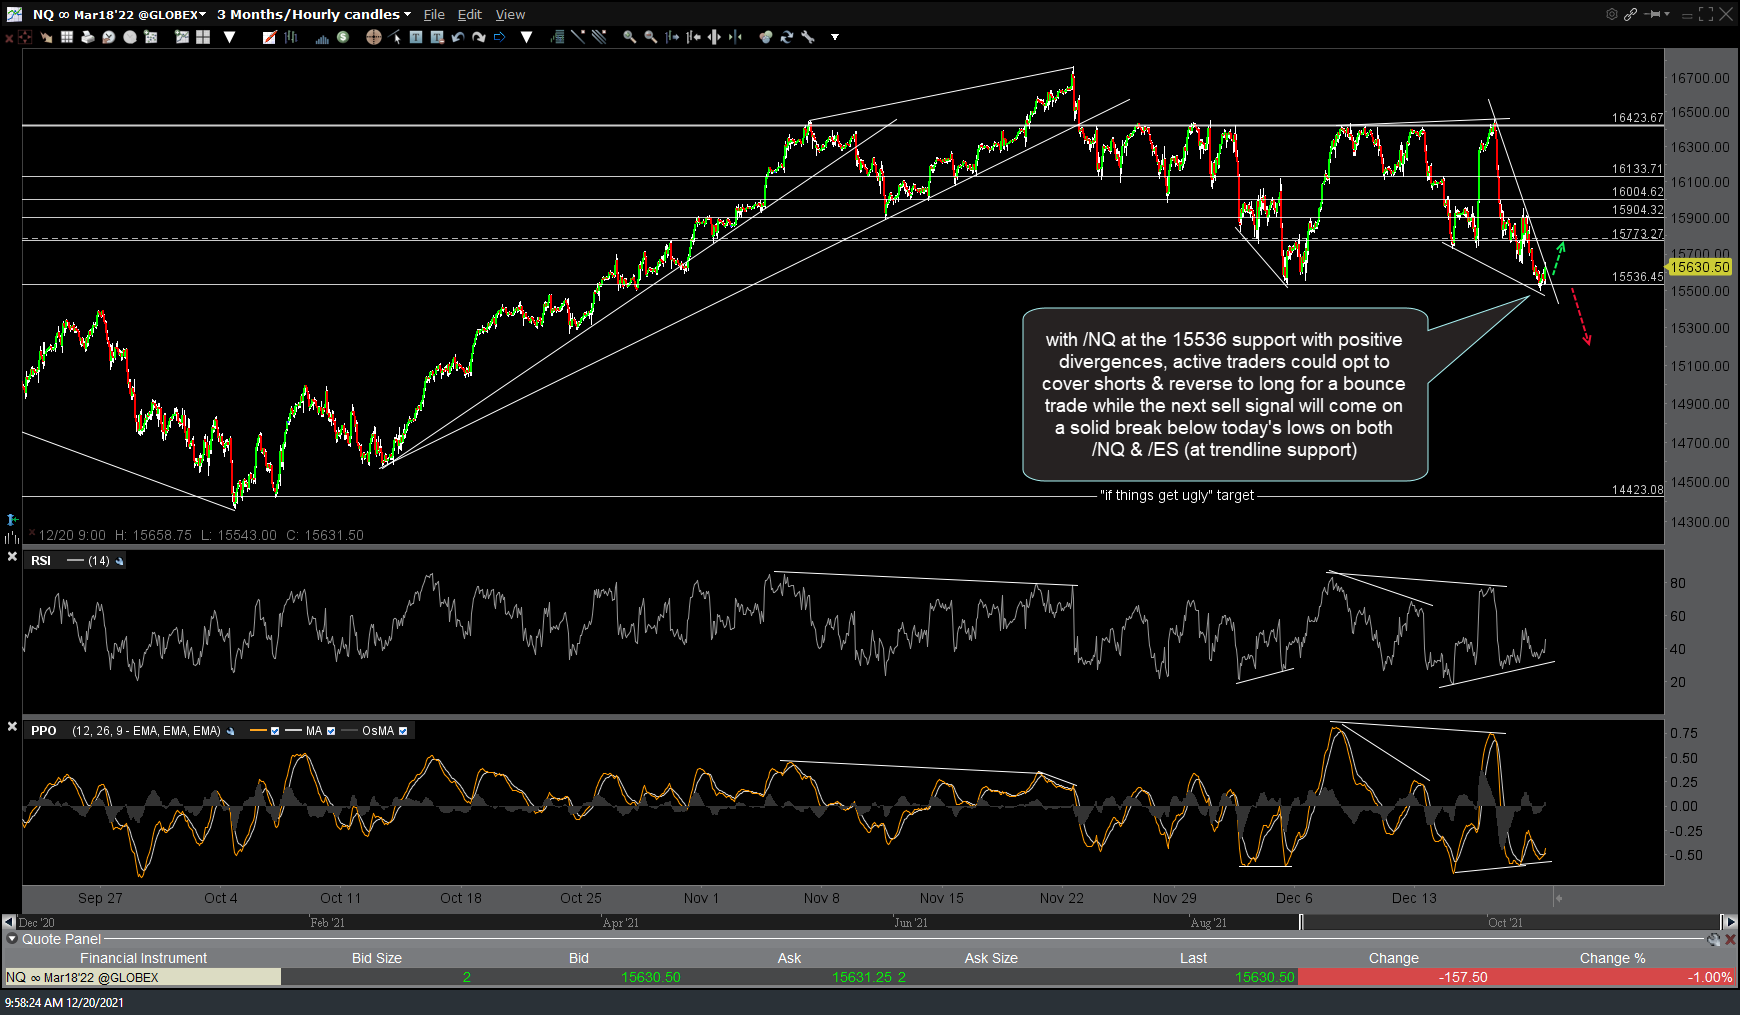
NQ 60m Dec 20th
Likewise, /ES is trading at uptrend line support with RSI divergence, thereby providing an objective level for active traders to reverse from short to long for a bounce trade while a solid break and/or 60-minute close below the trendline (as well as /NQ below 15500) will trigger the next sell signal. Remember, we’ve had multiple sell signals on various time frames recently (60-minute, daily, & weekly). With the market remaining on a sell signal, typical swing traders might opt to sit tight on existing short positions and/or add on rallies back into resistance or breaks below support. Active traders attempting to game counter-trend bounces at this point should consider targeting just shy of the lower potential targets as bounces have been getting sold into early & that trend is likely to continue & even accelerate if/as the market moves lower from here.
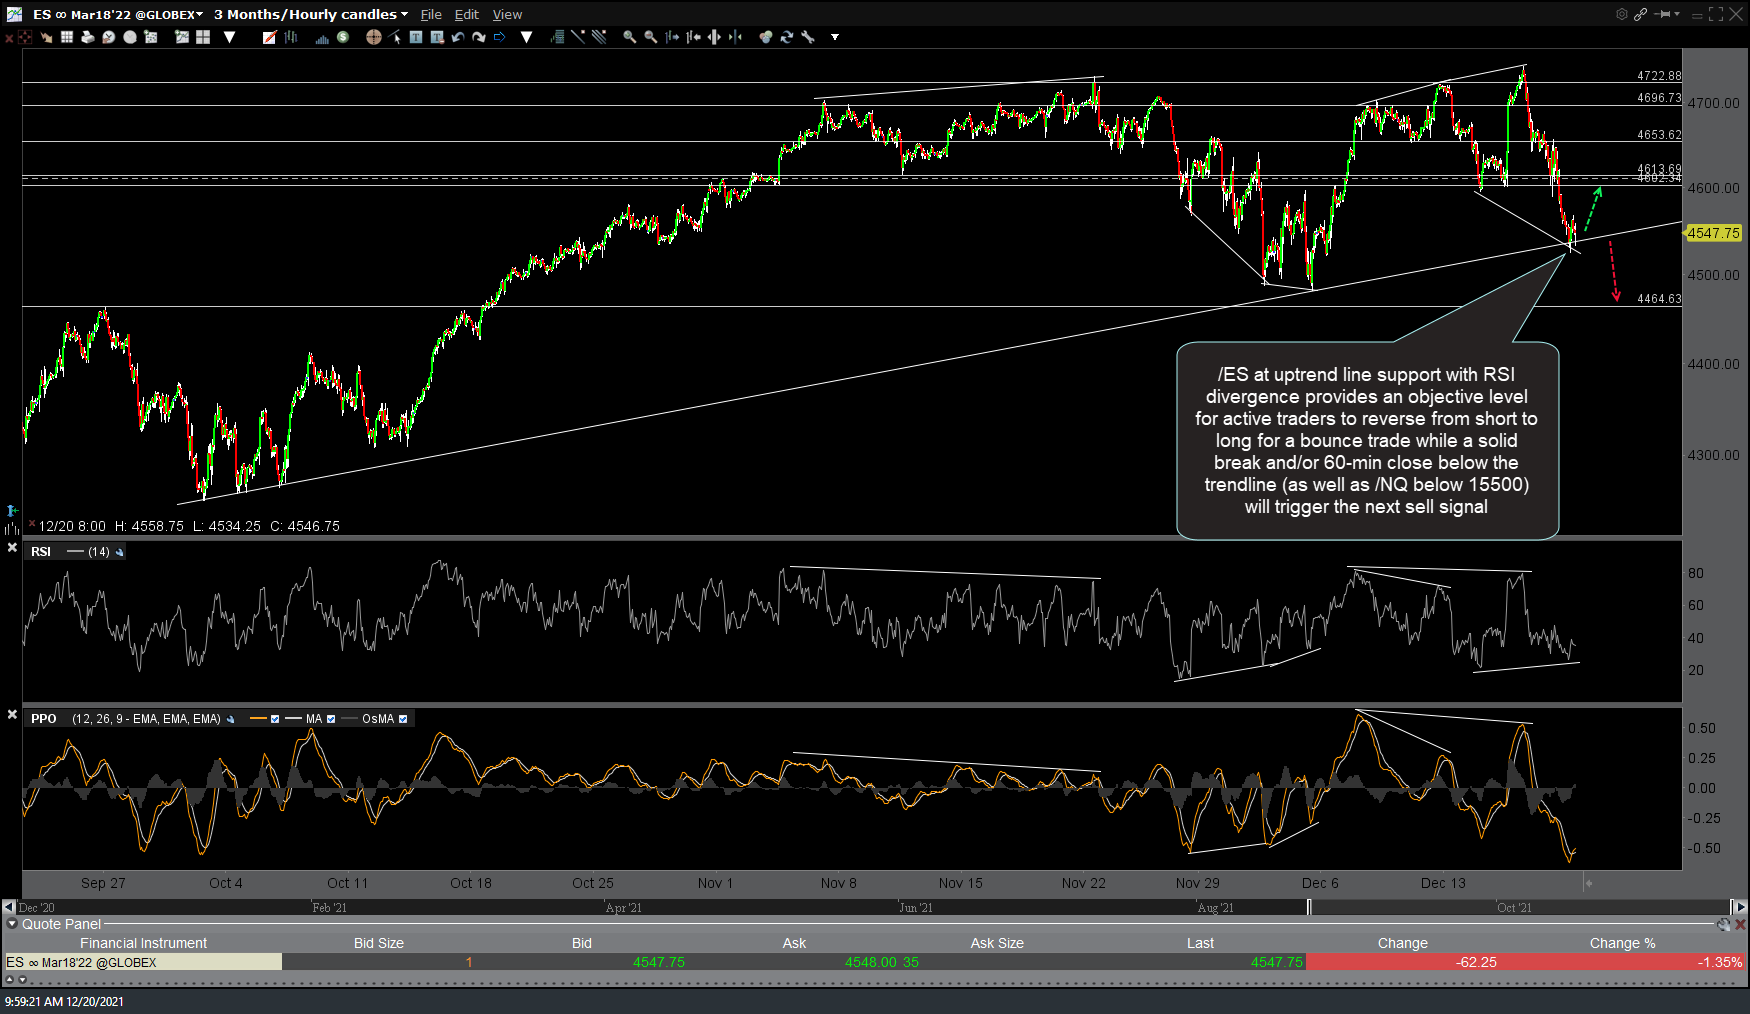
ES 60m Dec 20th