
Both /ES (S&P 500) and /NQ (Nasdaq 100) E-mini futures are testing decent support levels following the corrections that started yesterday & carried over into the overnight trading session. As it appears to me the odds for a bounce today are decent, on the 60-minute chart below, I have listed some potential near-term bounce targets for /NQ assuming it can hold above the 11555ish support level.
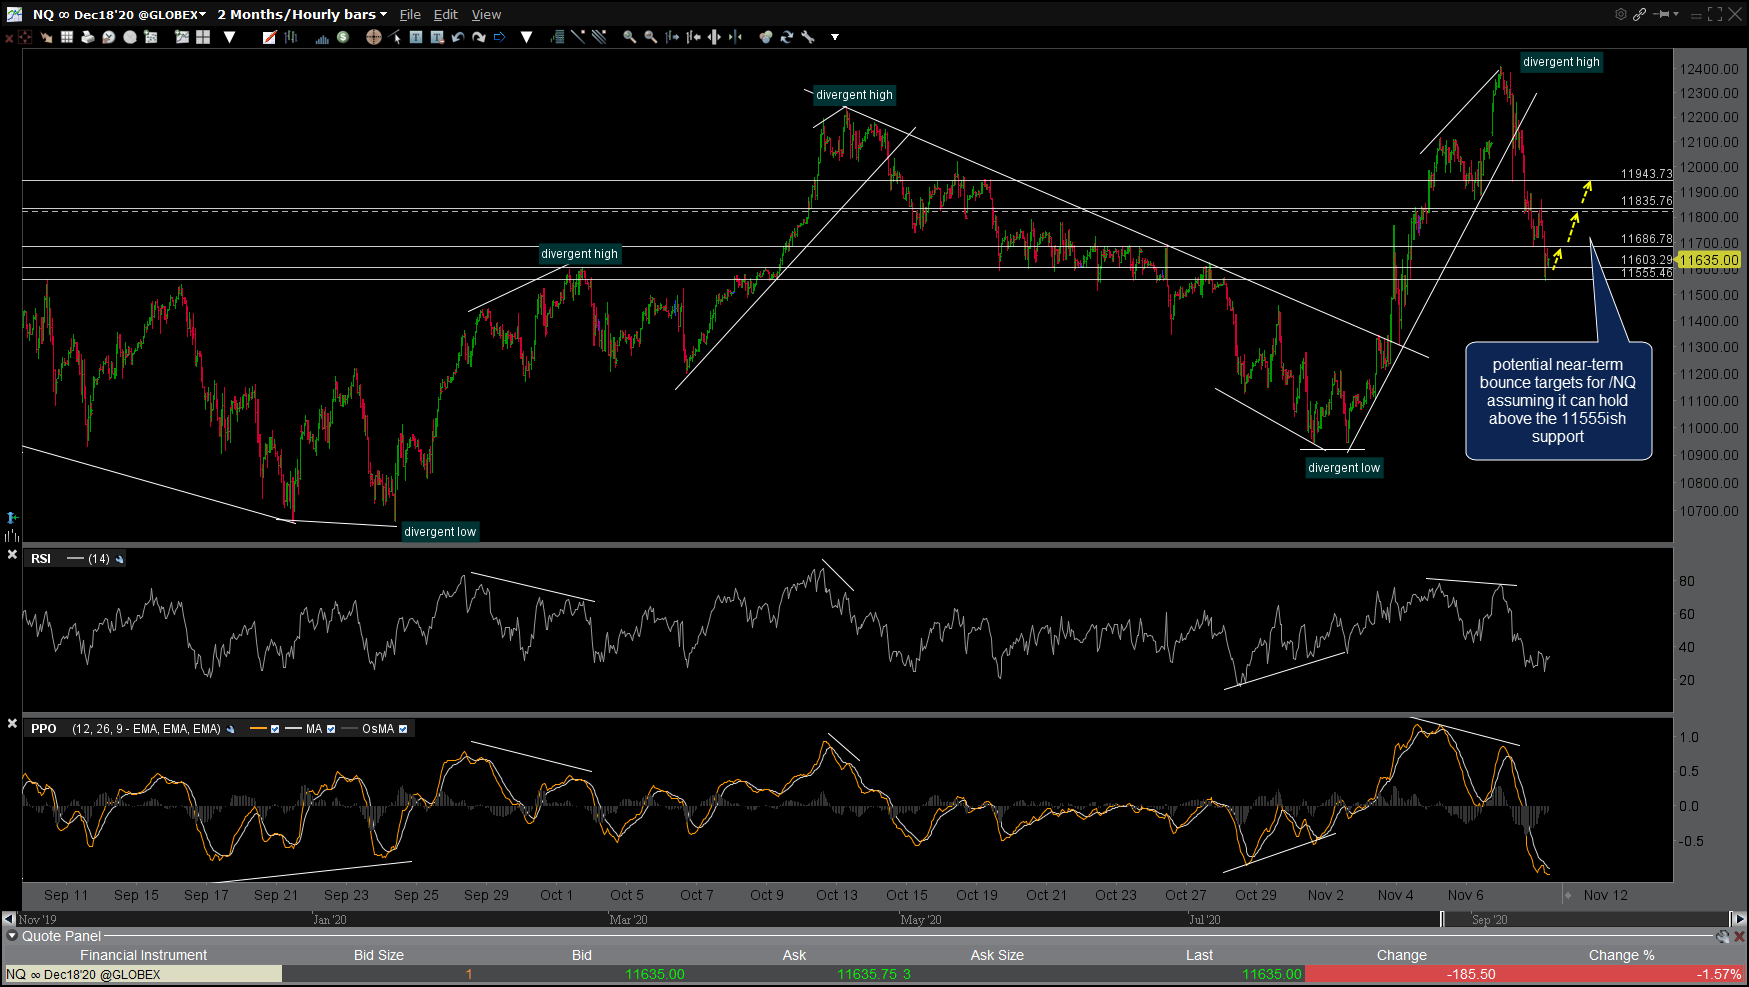
NQ 60m Nov 10th
On the 60-minute chart of /ES below, other than minor resistance around 3560 (not shown on this chart although you can see a couple of recent reaction highs around that level) there really isn’t much overhead resistance other than any backtest of the uptrend line from below as well as that white line around the 3588ish level. As such, that would be a potential near-term bounce target around 3588 & a backtest of the trendline, assuming that /ES also continues to hold above the 3520 support level.
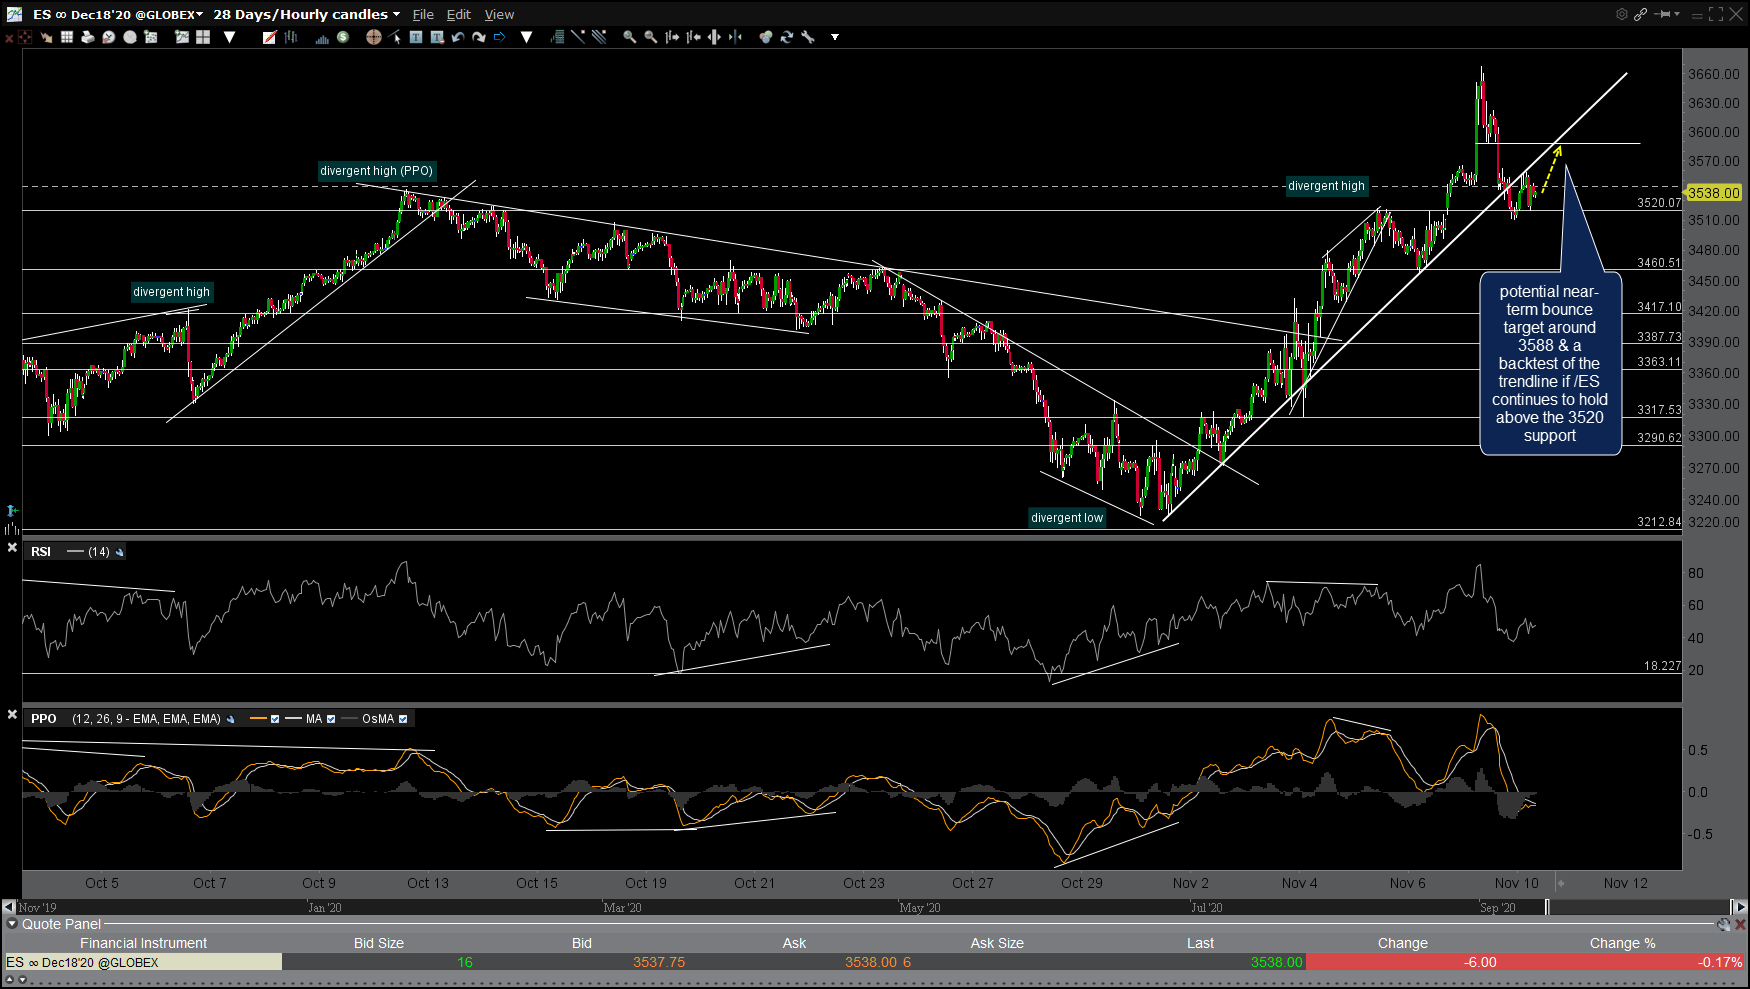
ES 60m Nov 10th
Should both /ES & /NQ solidly break below these support levels that have so far contained the pullback (other than a brief whipsaw drop below followed by a recovery back above), that could open the door to another leg down to at least the 3460ish level on /ES & 11230ish support on /NQ and/or those potential gap backfills on QQQ and/or SPY covered in last night’s closing market wrap video.
FWIW, my convictions on my preferred bounce scenario aren’t very high but a long entry here with a stop below the recent lows, ideally on a solid 60-minute candle below in order to avoid any pre or post-opening whipsaws, seems objective with an attractive R/R, especially if the 11835ish and/or 11943ish targets on /NQ are hit.
It is also worth noting that /NQ has some decent positive divergence on the 15-minute time frame & should /ES spike down to make a marginal new low soon, it would also be a divergent low on the 15-minute charts. Last but not least, should we bounce today and/or into tomorrow, it appears that the Nasdaq 100 will likely outperform the S&P 500.