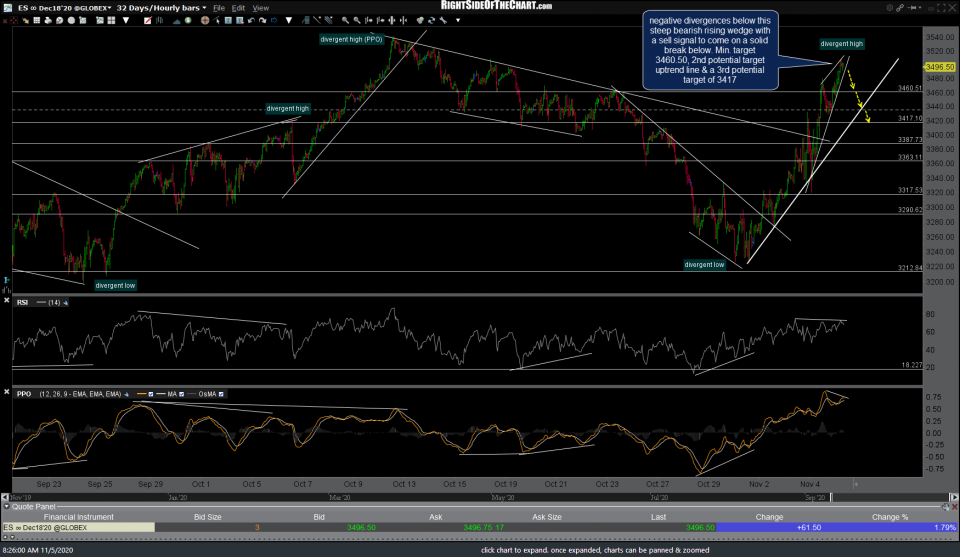
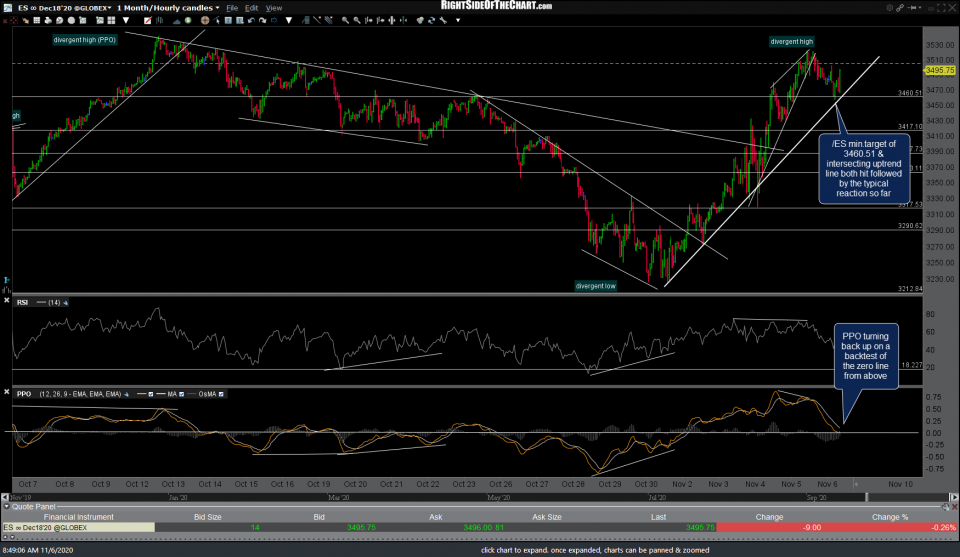
/ES (S&P 500 futures) hit the minimum pullback target of 3460.51 & intersecting uptrend line both hit followed by the typical reaction so far with the PPO turning back up on a backtest of the zero line from above. Previous & updated 60-minute charts below.
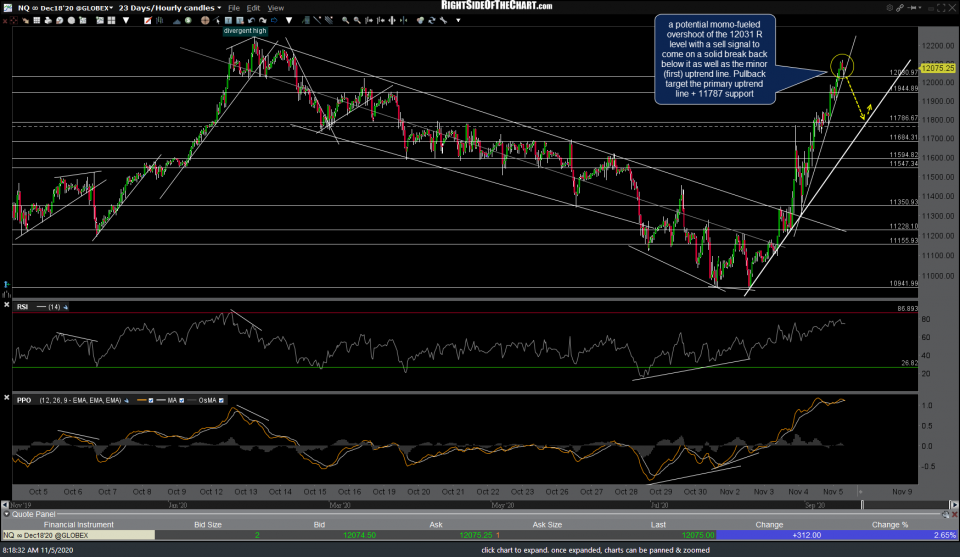
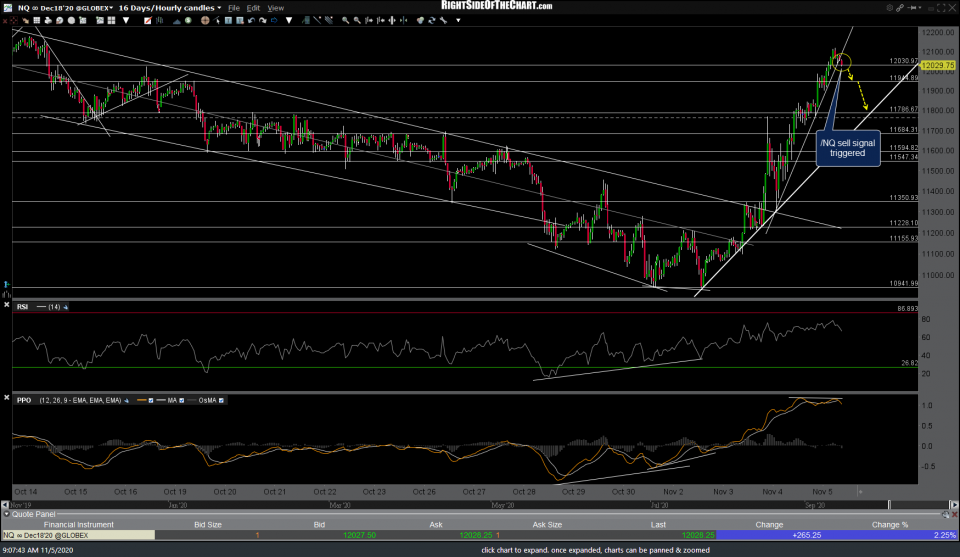
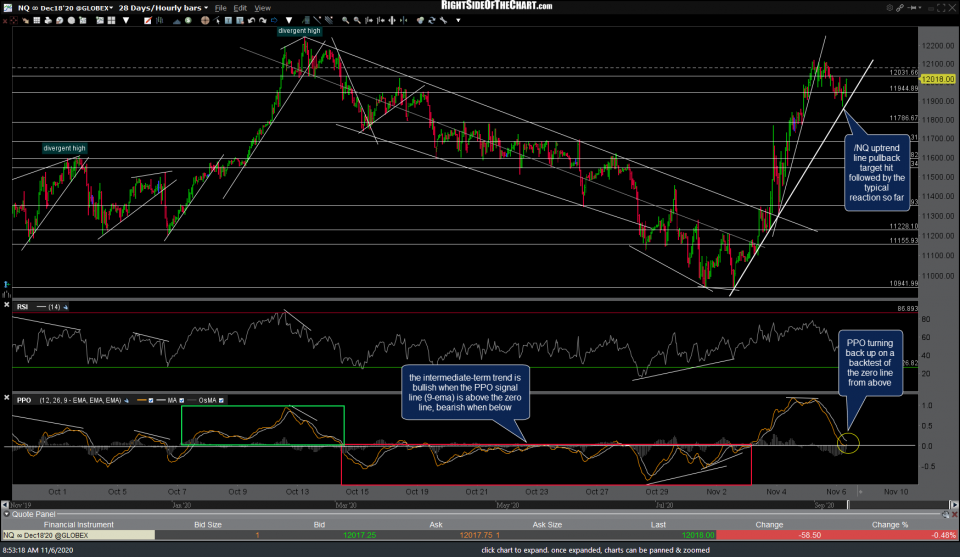
/NQ (Nasdaq 100) also hit the uptrend line pullback target hit followed by the typical reaction so far with the PPO also turning back up on a backtest of the zero line from above. The near-to-intermediate-term trend is bullish when the PPO signal line (9-ema) is above the zero line, bearish when below. Previous & updated 60-minute charts below.
As much as I’d like to make another “micro-call” as to where we go from here, my convictions aren’t high enough so I’d like to see how the market trades after the regular session get underway although the posture of the PPO on both /ES & /NQ remains bullish until & unless they both make solid crosses back down below their respective zero lines. Updates on some of the other recent trade ideas to follow.


