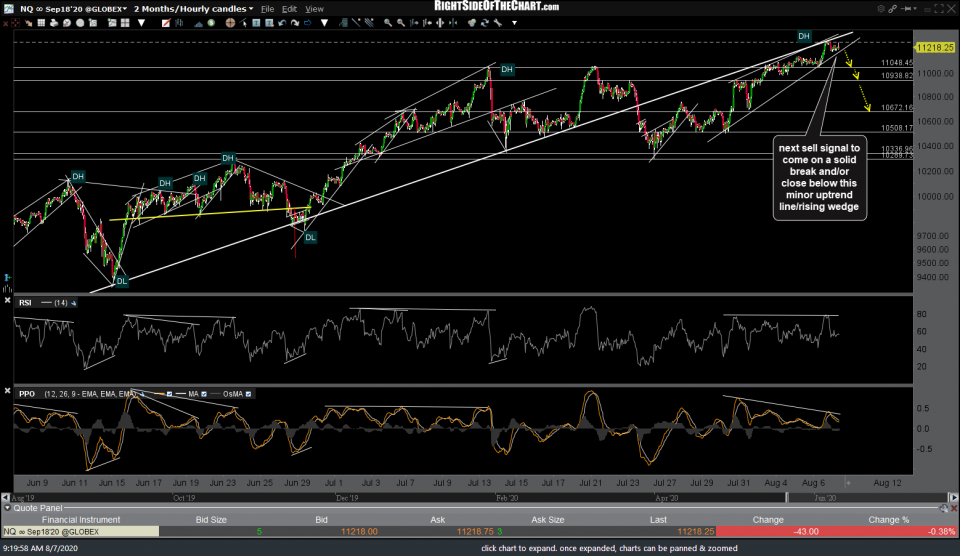
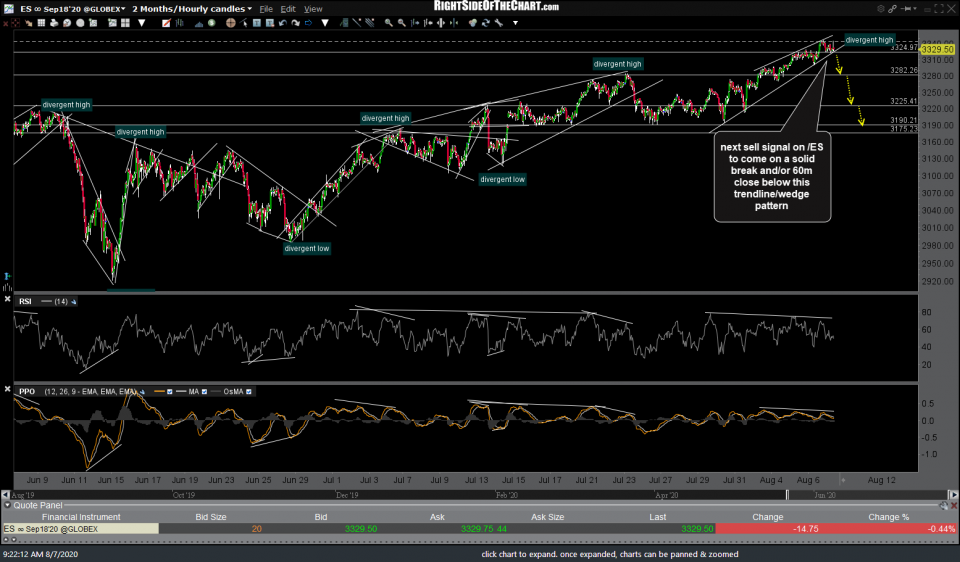
It’s been a while since I’ve seen what appears to be some pretty clean setups with objective entries, long or short, on the 60-minute charts of /ES (S&P 500 futures) and /NQ (Nasdaq 100). Both now have some fairly well-defined uptrend lines with negative divergence that forms bearish rising wedge patterns on both. Starting with the lead sled dog, /NQ, the next sell signal to come on a solid break and/or close below this minor uptrend line/rising wedge.
Likewise, the next sell signal on /ES will come on a solid break and/or 60-minute close below this trendline/wedge pattern. Of course, best to see both /ES & /NQ sell signals triggered as a breakdown in one without the other will often lead to a whipsaw (false) sell signal.
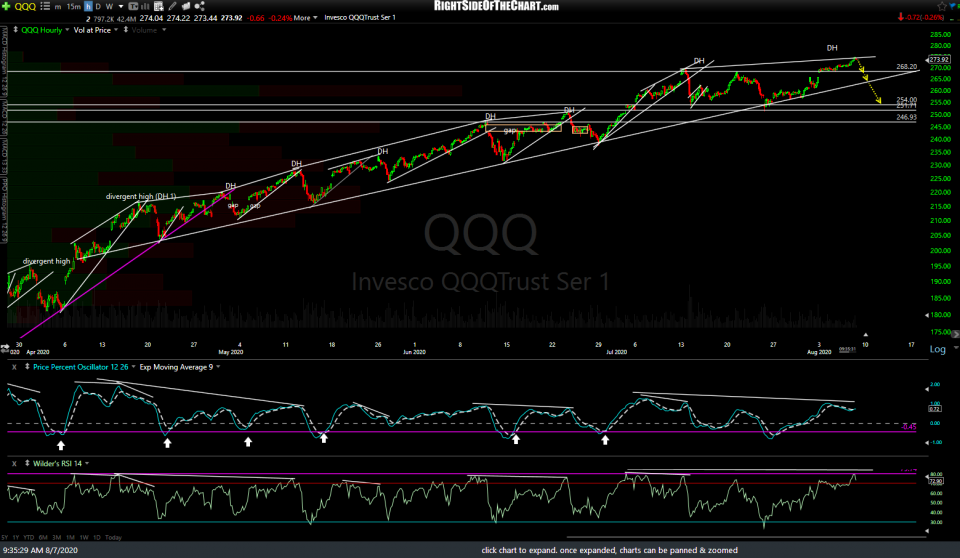
As of now, the uptrend remains clearly intact without any sell signals. The 60-minute chart of QQQ below has some nearby support level which could be targeted as well, with a preferred near-term swing target around the 251.71-254 support zone, which would equate to a ~7% pullback (same as the previous correction a few weeks ago), if hit.
Please note that I will be away from my desk most of today & will reply to any questions or comments as soon as I return.


