
We just had an impulsive rejection off the minor downtrend line after numerous failed attempts/tests since just after midnight & throughout today so far. Still awaiting a solid break & close below 2754 for the next sell signal in /ES (S&P 500 futures).
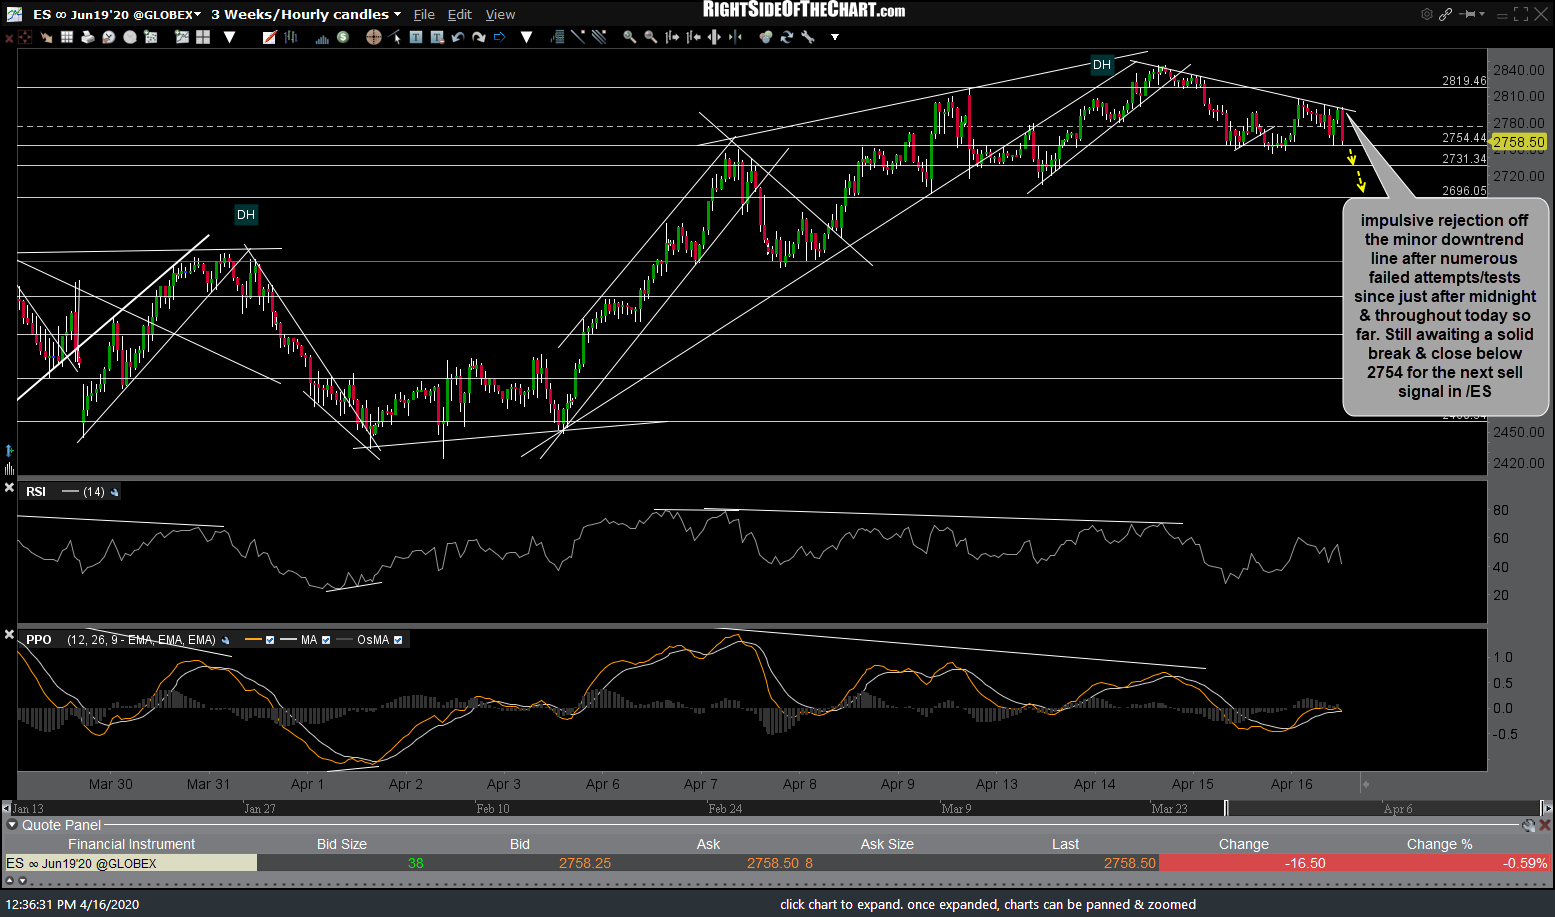
ES 60m 2 April 16th
While continuing to outpace the broad market by nearly double the percentage gains, today’s marginal new high in /NQ was simply an extension of the previous divergent high, potentially paving the way for an even larger drop with a sell signal pending a break below this primary uptrend line (added since the previous /NQ 60-minute chart posted earlier today). Should /NQ go on to hit the 7952 target from here, that would account for a drop of about 9.5% from today’s divergent high.
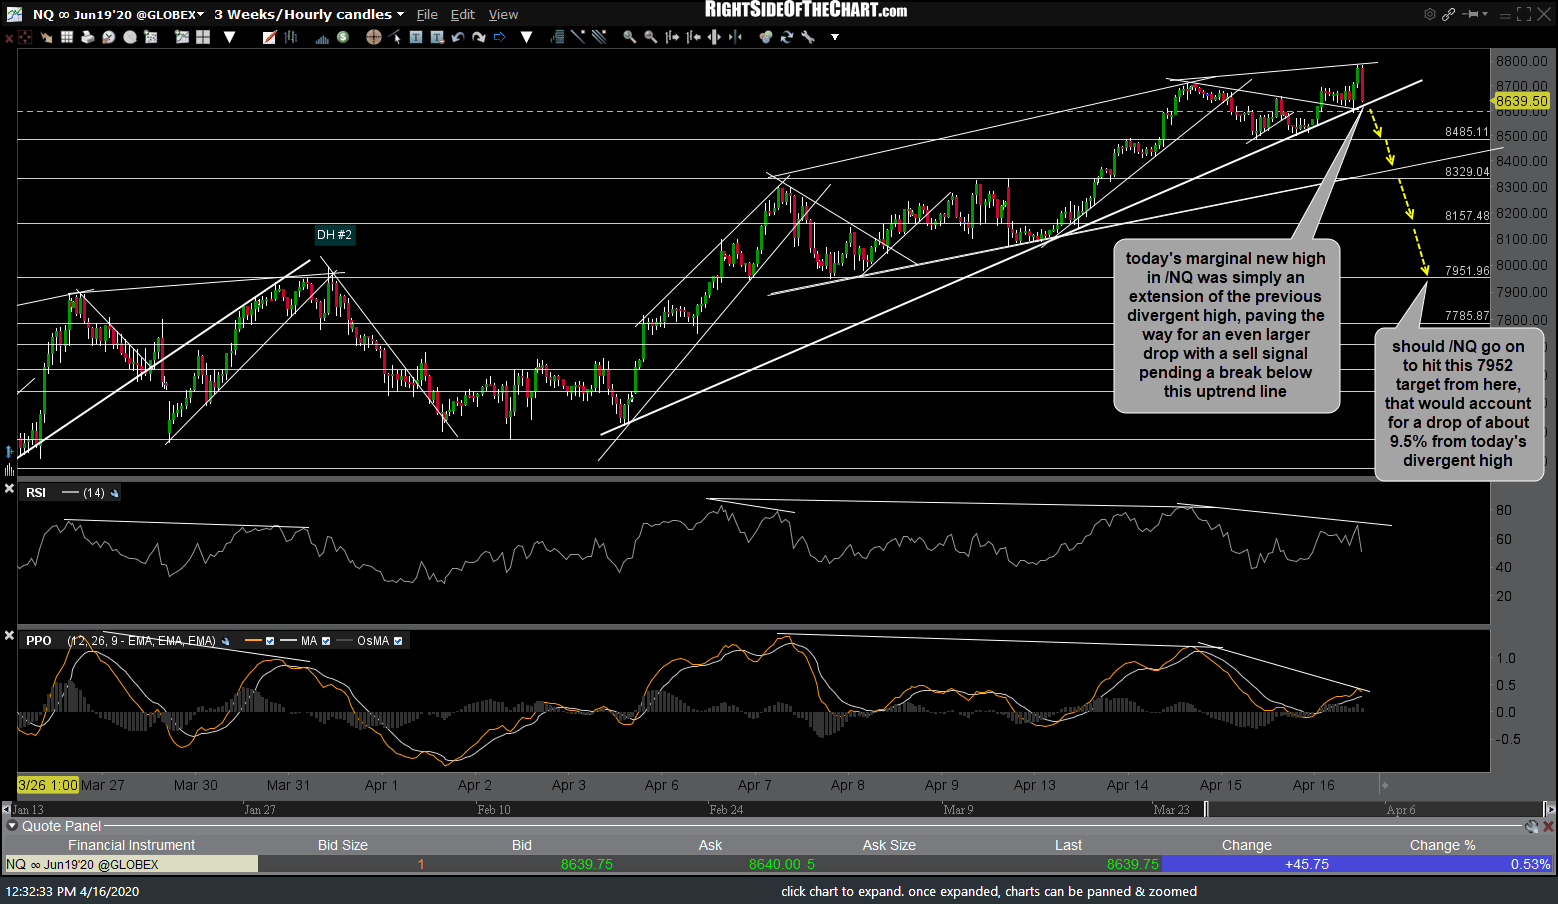
NQ 60m 2 April 16th
Bottom line: Most of the longer-term & intermediate-term trend indicators on the stock market remain bearish while the near-term trend remains bullish, for now, with both the S&P 500 & Nasdaq 100 currently testing key support. As I like to say, support is support until & unless broken. Should these support levels get taken out with conviction, despite the near-term bullish trend, the bearish technical posture of the 60-minute charts coupled with the posture of the longer-term charts indicates that the stock market could be on the verge of the next sharp leg down.
At the risk of oversimplifying things, the way it works is that if & as each of the support levels on the charts above are taken out, especially if followed by impulsive selling, that increases the odds for a continued move down to the next support level(s) and so on & so forth.