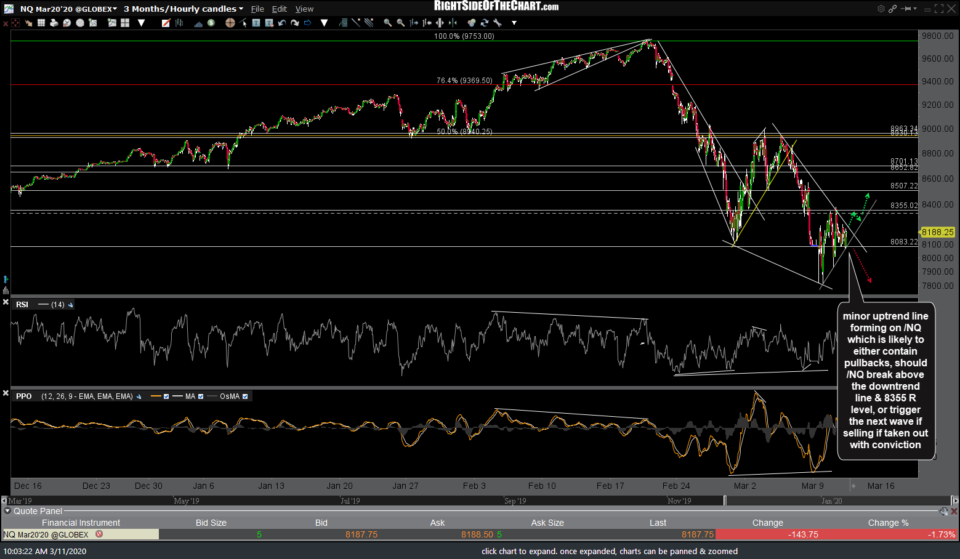
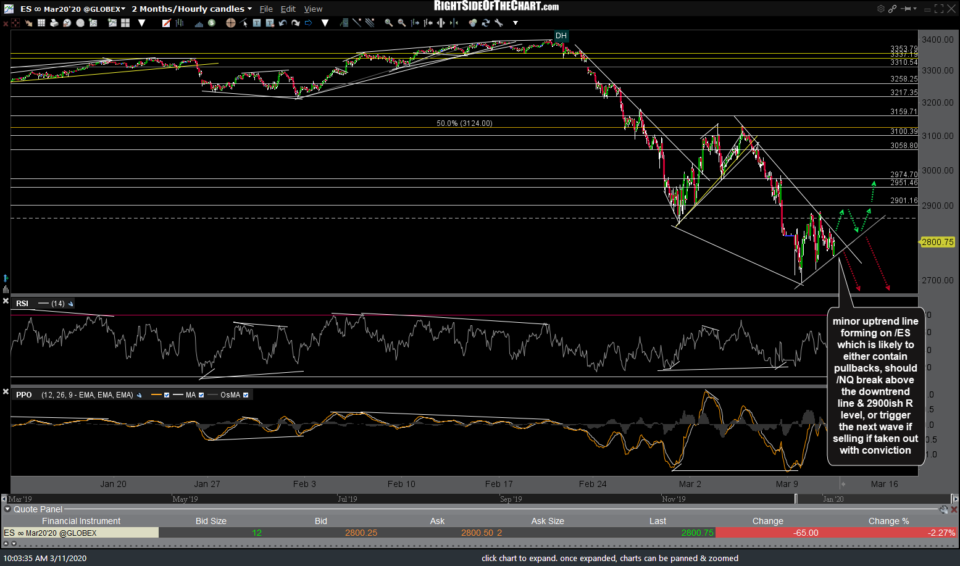
Both /ES & /NQ have started to form potential uptrend lines off Monday’s lows while currently trading just below the downtrend lines generated off last Wednesday’s highs. Essentially, the stock futures are sandwiched between those support & resistance and a solid break above or below has the potential to determine the next near-term trend & possibly the intermediate-term direction of the stock market.
The 60-minute chart below shows the minor uptrend line forming on /NQ which is likely to either contain pullbacks, should /NQ break above the downtrend line & 8355 resistance level or trigger the next wave of selling if taken out with conviction.
We also have a comparable minor uptrend line forming on /ES which is likely to either contain pullbacks, should /NQ break above the downtrend line & 2900ish resistance level or trigger the next wave of selling if taken out with conviction. Similar trendlines can be drawn on SPY & QQQ although the lines on the stock index futures seem to have a better “fit” IMO. I’m still favoring the bearish scenario with a break of Monday’s lows & more downside to come although I am certainly open to the potential for the bullish scenario to play out as both the S&P 500 & Nasdaq 100 are still trading above those key support levels which were tested on Monday and the bullish divergences on the 60-minute chart are still very much intact for now.
Active traders should stay nimble while typical swing & trend traders might opt to tune out the “noise” of the very short-term zigs & zags in the market & focus on the key bullish or bearish developments. As of now, the long-term trend in the market remains bullish with both the intermediate & short-term trends bearish.


