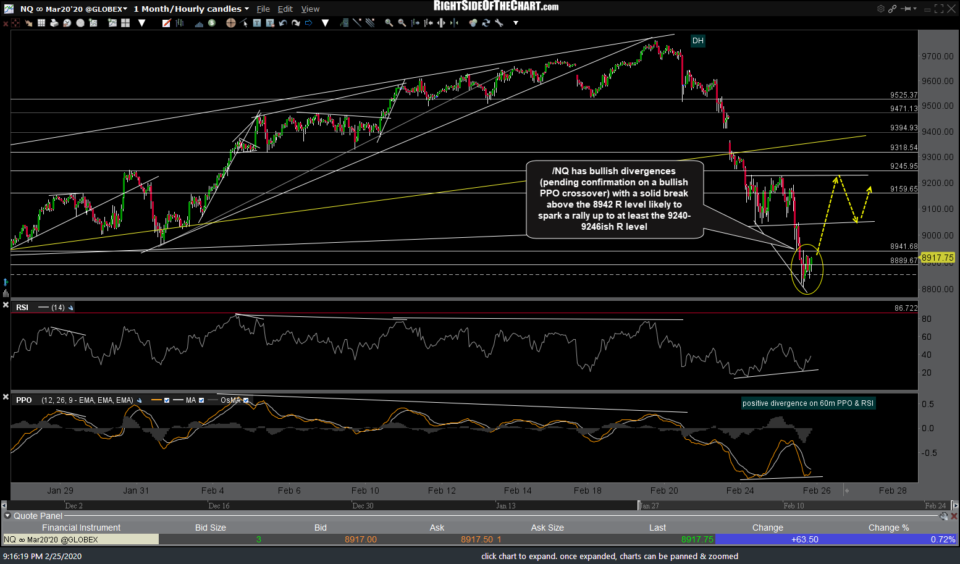
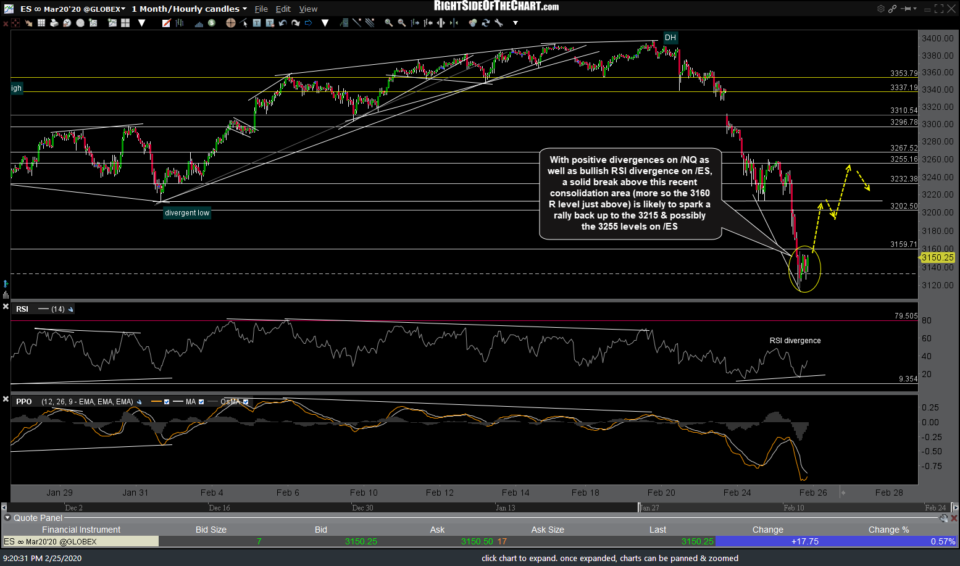
While I was leaning towards more downside as of the close today, upon further review of the charts of the major stock index futures, it appears that the odds for a substantial rally would be decent if both the/NQ (Nasdaq 100 futures) and /ES (S&P 500 futures) can take out the following resistance levels with convictions later tonight and/or tomorrow. As I like to say, a trade setup is only a potential trade pending a buy (or sell) signal so as of now, the recent consolidation in the stock futures since midday today may either prove to be a pause on the way down to the next downside targets/support levels previously highlighted or the energy building like a coiled spring to fuel the first decent counter-trend rally since the Feb 19th high.
/NQ has bullish divergences (pending confirmation on a bullish PPO crossover) with a solid break above the 8942 resistance level likely to spark a rally up to at least the 9240-9246ish resistance level since the ~9% drop off Wednesday’s highs began. 60-minute chart below.
With positive divergences on /NQ as well as bullish RSI divergence on /ES, a solid break above this recent consolidation area (more so the 3160 resistance level just above) is likely to spark a rally back up to the 3215 & quite possibly the 3255 levels on /ES.
As I like to say: Resistance is resistance until & unless taken out and as for as of now, the stock market remains in a powerful near-term downtrend without the slightest evidence of a reversal or any buy signals at this time. With that being said, I would put fairly decent odds (50-60%+) that the indexes go on to trigger the aforementioned near-term buy signals with ~3%+ upside potential, if so. I’ll be shutting down to for the night shortly but just wanted to pass along these levels for those interested.


