
As I had mentioned in the previous market update today, periods of stark expansion in volatility that come directly on the heels of periods of abnormally low-volatility steady-grinds higher, such as we’ve had in recent weeks, typically don’t end very well for the stock market. The chart below provides a quick visual comparison on QQQ between the low-volatility grind higher from March 29-April 22, 2019 and the subsequent volatility expansion topping process followed by a 12% correction with the recent low-volatility grind from December 4th- December 24th/26th and the sharp increased in volatility since then.
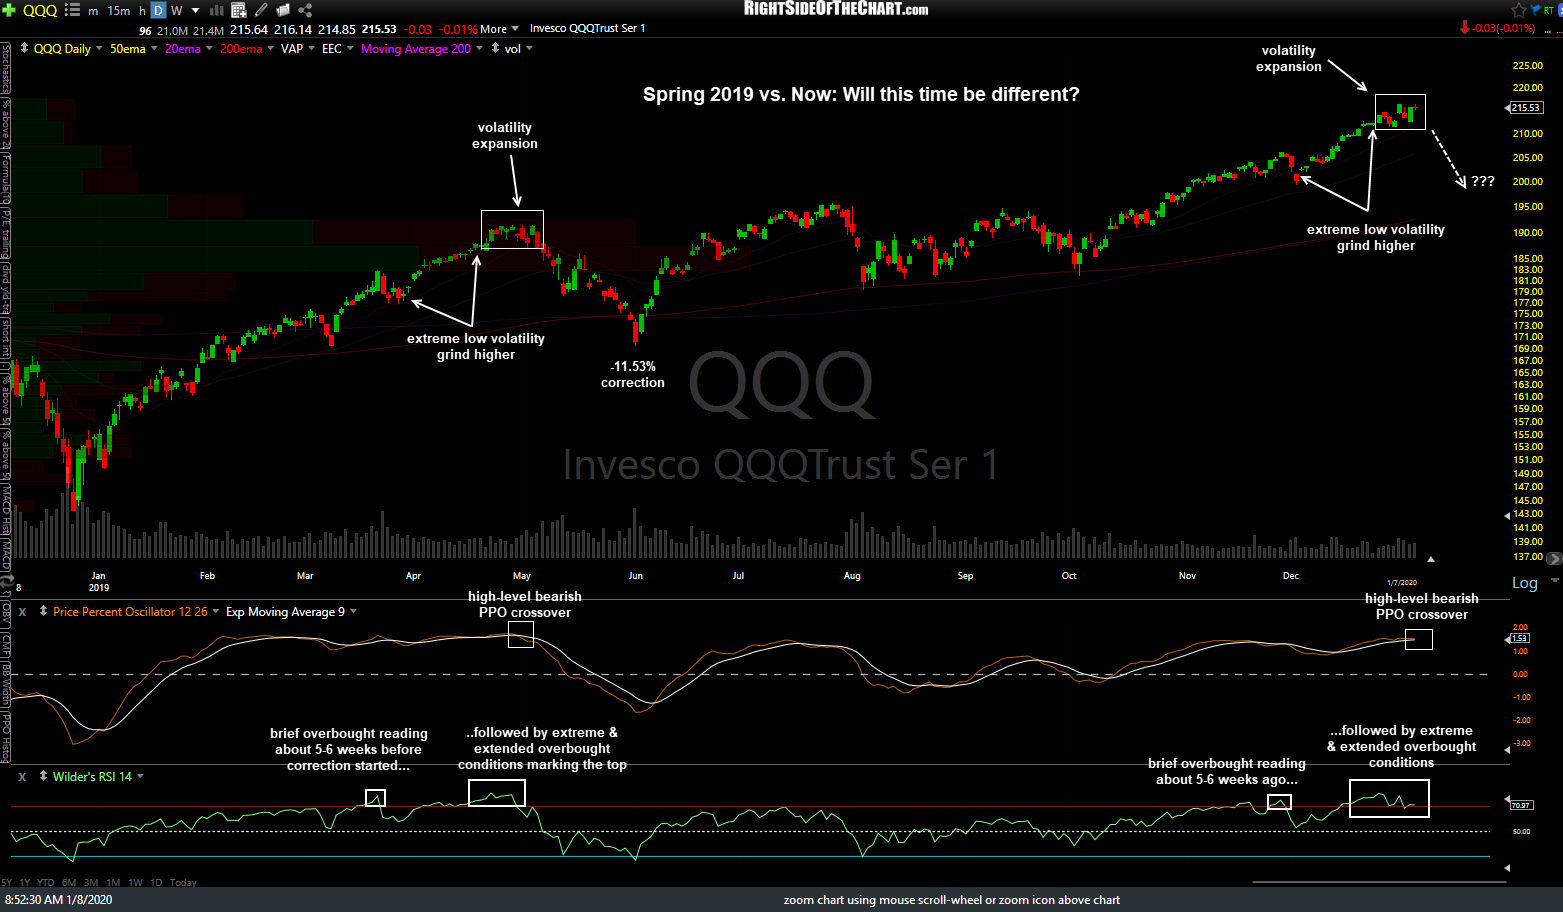
2019-2020 Volatility Expansion Comparison
Maybe this time will be different, maybe not. Either way, the market remains in a primary uptrend although on a near-term sell signal (at least, according to my analysis) since the breakdown on the Nasdaq 100 on December 30th so you know which way I’m leaning, FWIW. Some of the salient support levels & potential technical developments to watch for have been highlighted in recent market analysis so let’s see what the next week or so brings.
Good Trading!
-rp