The bullish divergences are still intact on the index futures, including this /ES 60-min chart. Arrow breaks indicate the key resistance levels which could trigger more buying if taken out.
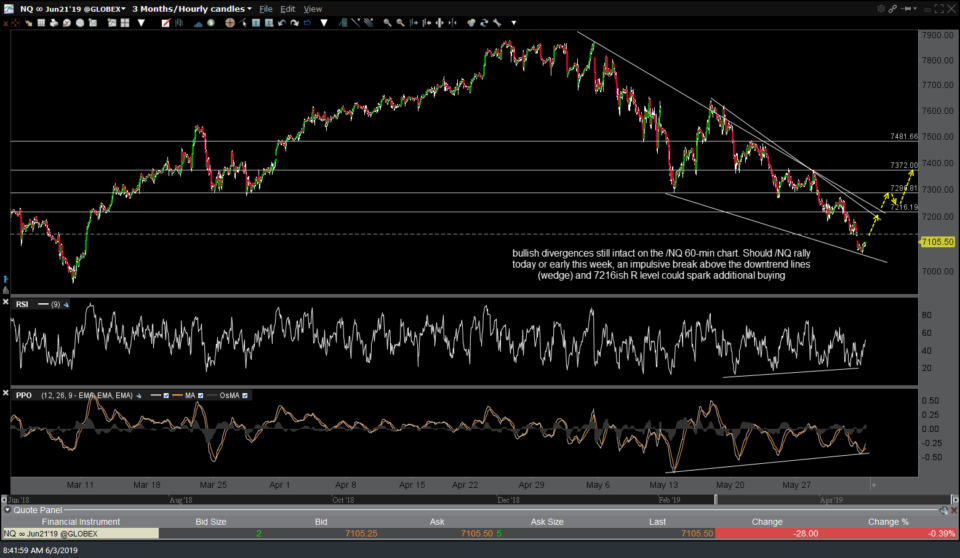
Bullish divergences are still intact on the /NQ 60-min chart. Should /NQ rally today or early this week, an impulsive break above the downtrend lines (wedge) and 7216ish R level could spark additional buying. Despite a relatively minor lift in the futures off their late-night/early morning session lows, the equity index futures are still trading negative, currently indicating a gap down at the open today as I type although I suspect that might change by or shortly after the opening bell.
As of now, the equity markets remain solidly entrenched in near-term & intermediate-term downtrends without any buy signals so if currently or looking to position long for a counter-trend rally, don’t get married to the trade & make sure to use stops inline with your preferred price target(s). The bounce targets for SPY & QQQ remain as posted on the recent 60-minute charts. Those charts, along with all recent analysis, can be viewed by clicking on the QQQ & SPY symbol tags located just below this post.
On a somewhat related note (as crude & equity remain positively correlated), bullish divergences on the RSI of this 60-min chart of /CL which is coming off short-term oversold levels with a sharp reversal off the overnight session lows increase the odds of a snap-back rally to the 56.80ish resistance level.
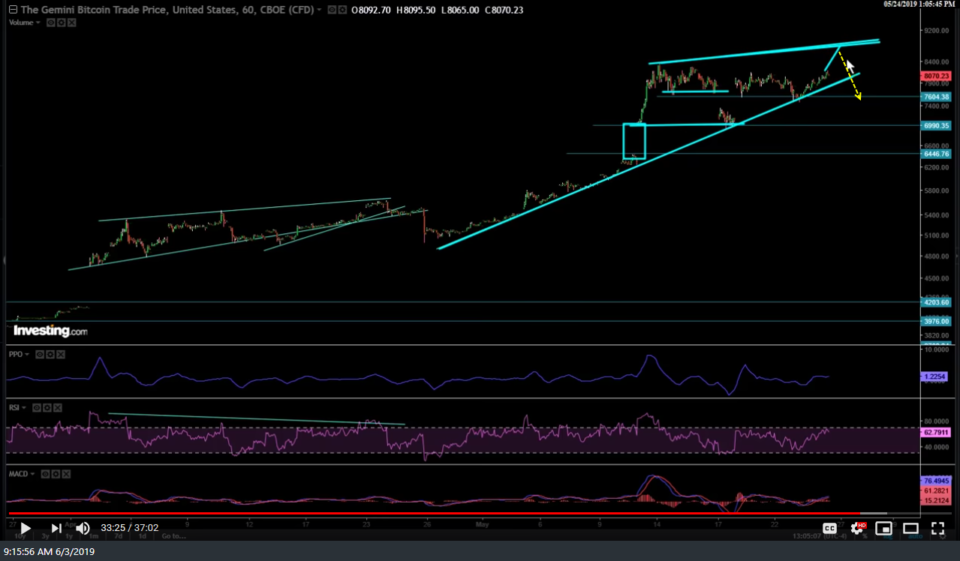
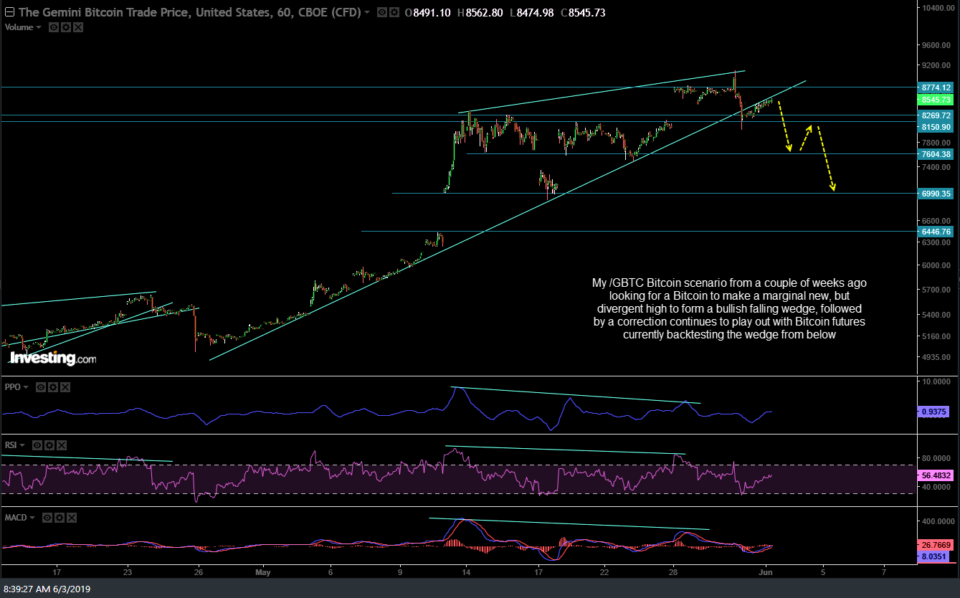
My /GXBT Bitcoin futures scenario from a couple of weeks ago looking for a Bitcoin to make a marginal new divergent high to form a bearish rising wedge, followed by a correction continues to play out with Bitcoin futures currently backtesting the wedge from below. 60-minute chart below with the screenshot from the May 24th video outlining that preferred scenario followed by the updated 60-minute chart. GBTC is a proxy for trading Bitcoin for those without access to a futures account.
- GXBT 5-24 video screenshot
- GXBT 60-min June 3rd


