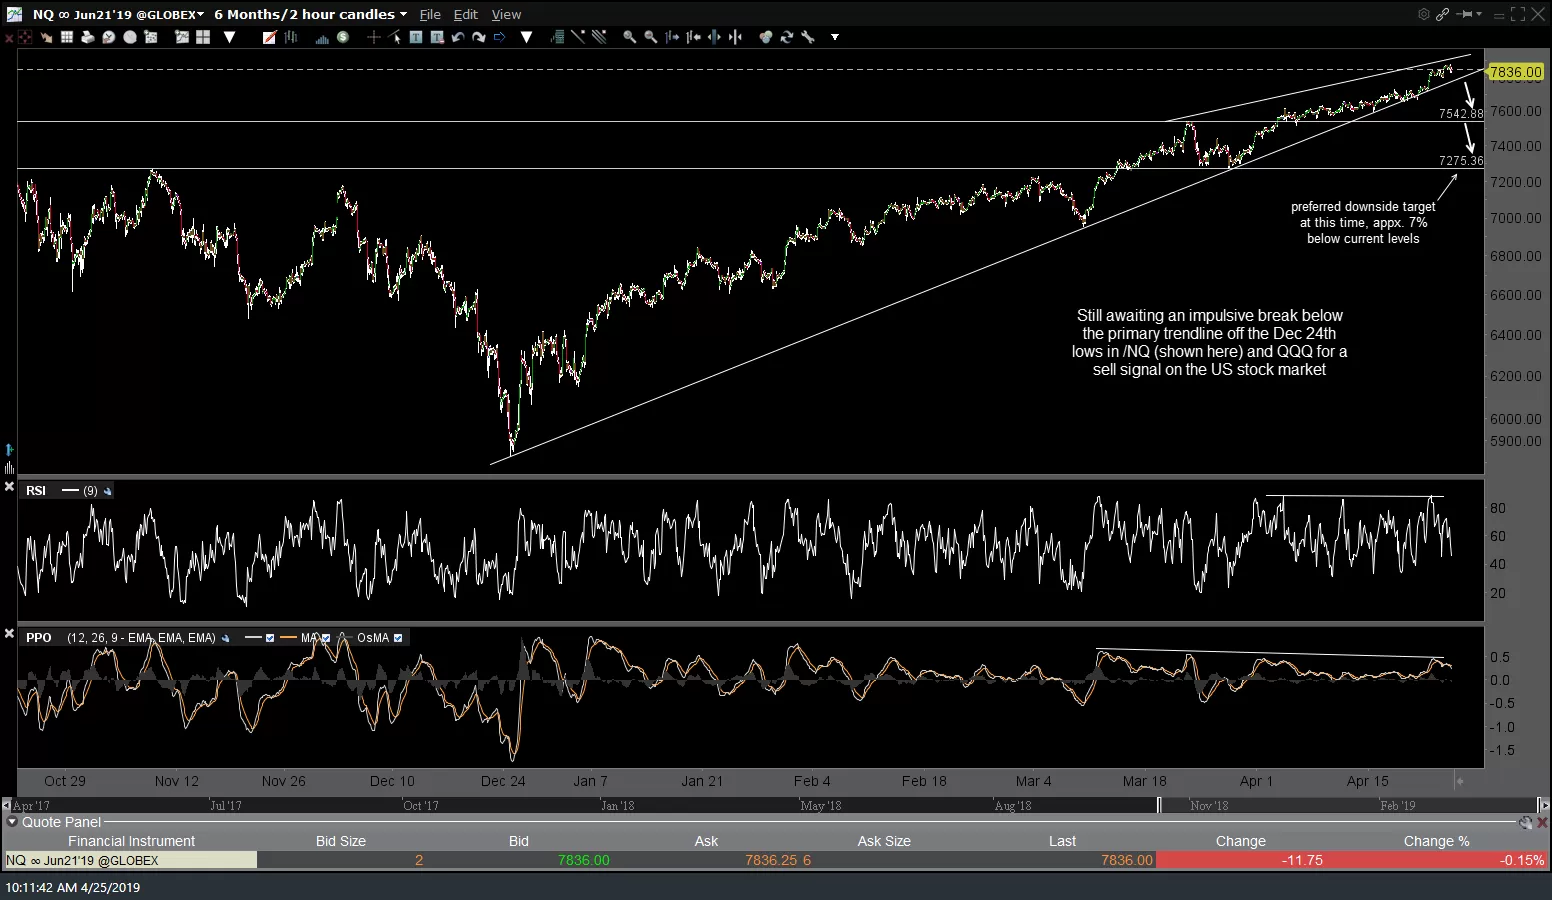
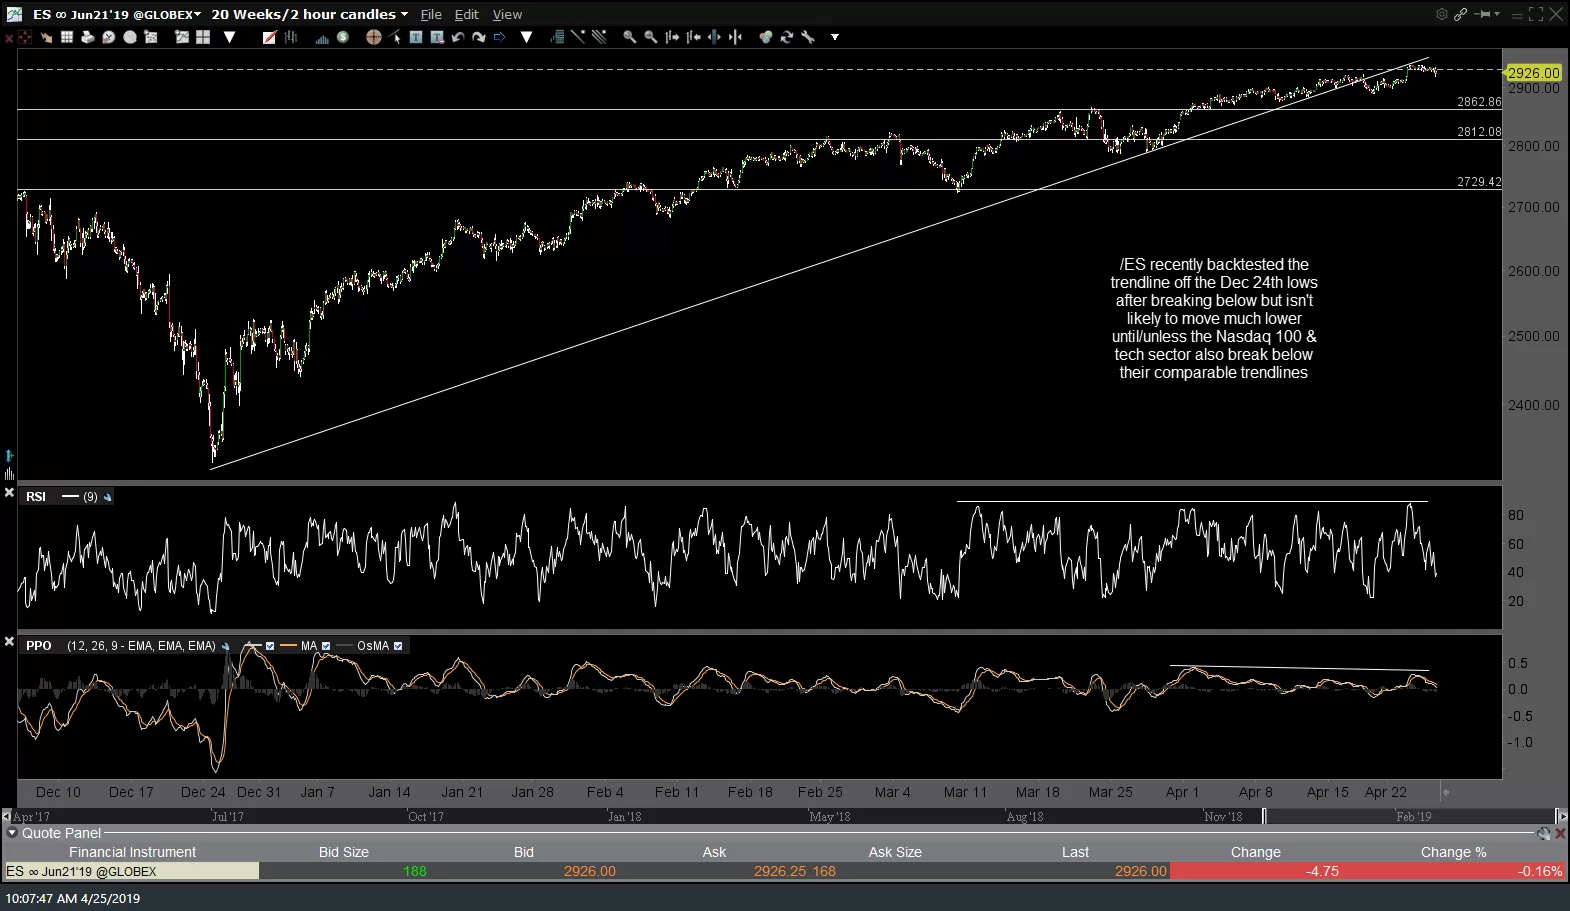
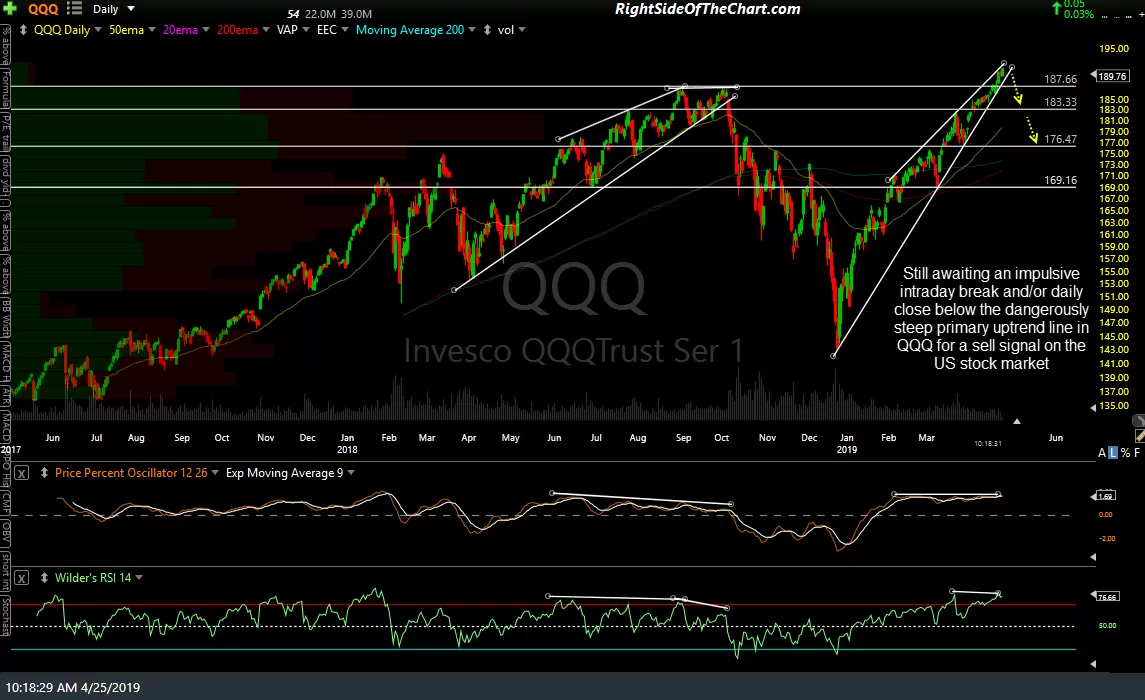
Here are the 120-minute charts of the S&P 500 & Nasdaq 100 tracking ETFs (SPY & QQQ) as well as the E-mini futures with some nearby levels to watch or trade off of. Basically, I’m still awaiting an impulsive break below the primary trendline off the Dec 24th lows in /NQ (shown here) and QQQ for a sell signal on the US stock market.
-
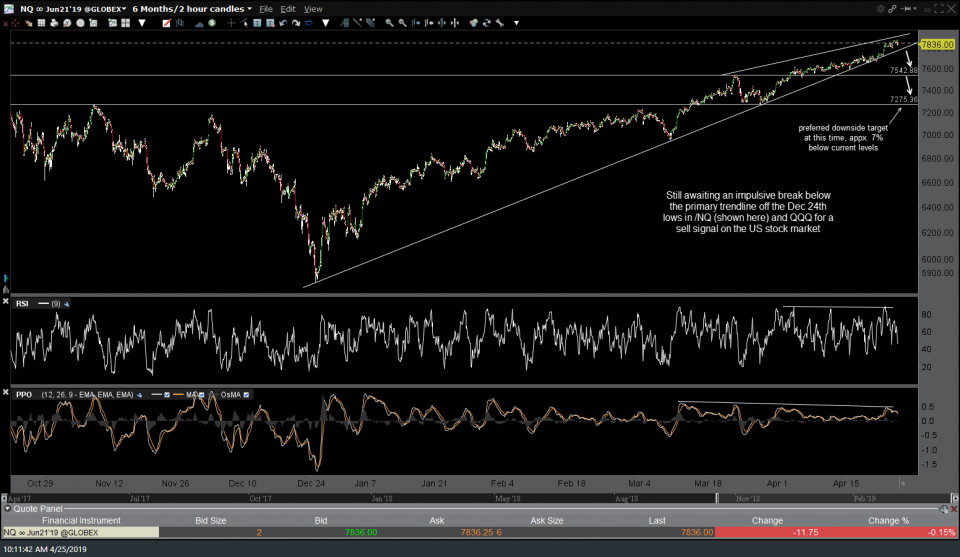
- NQ 120-min April 25th
-
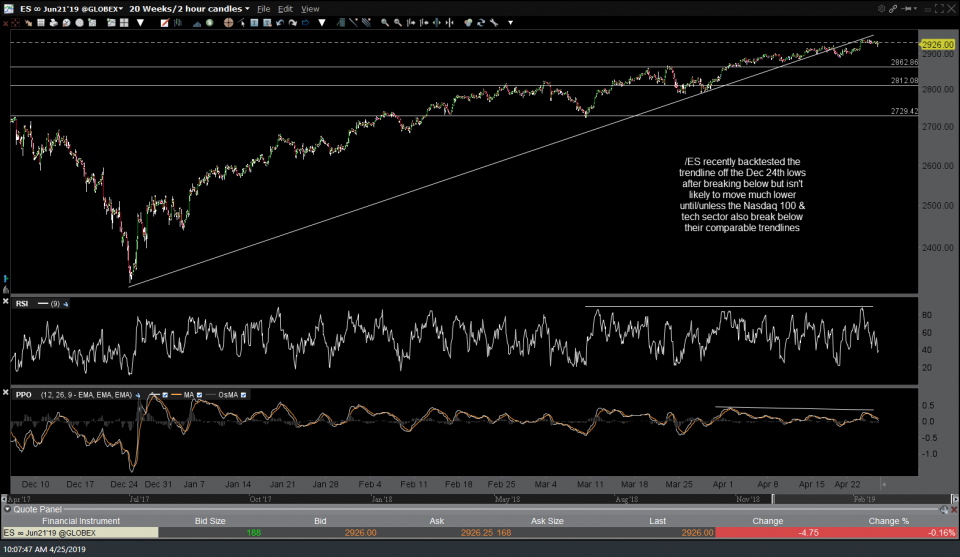
- ES 120-min April 25th
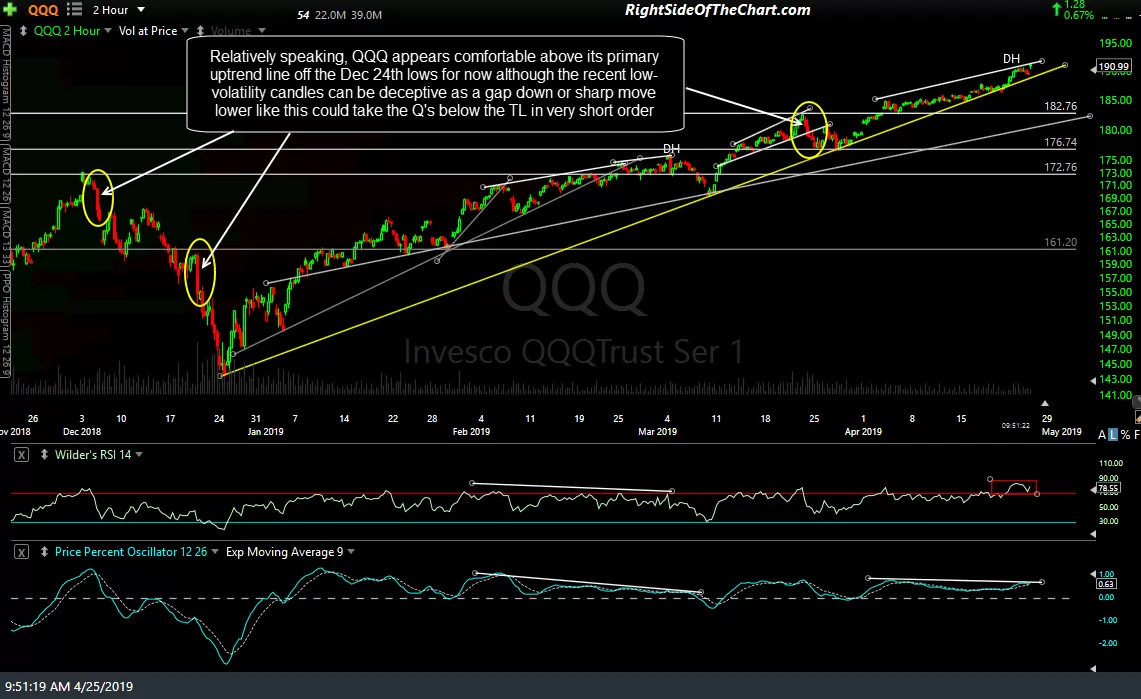
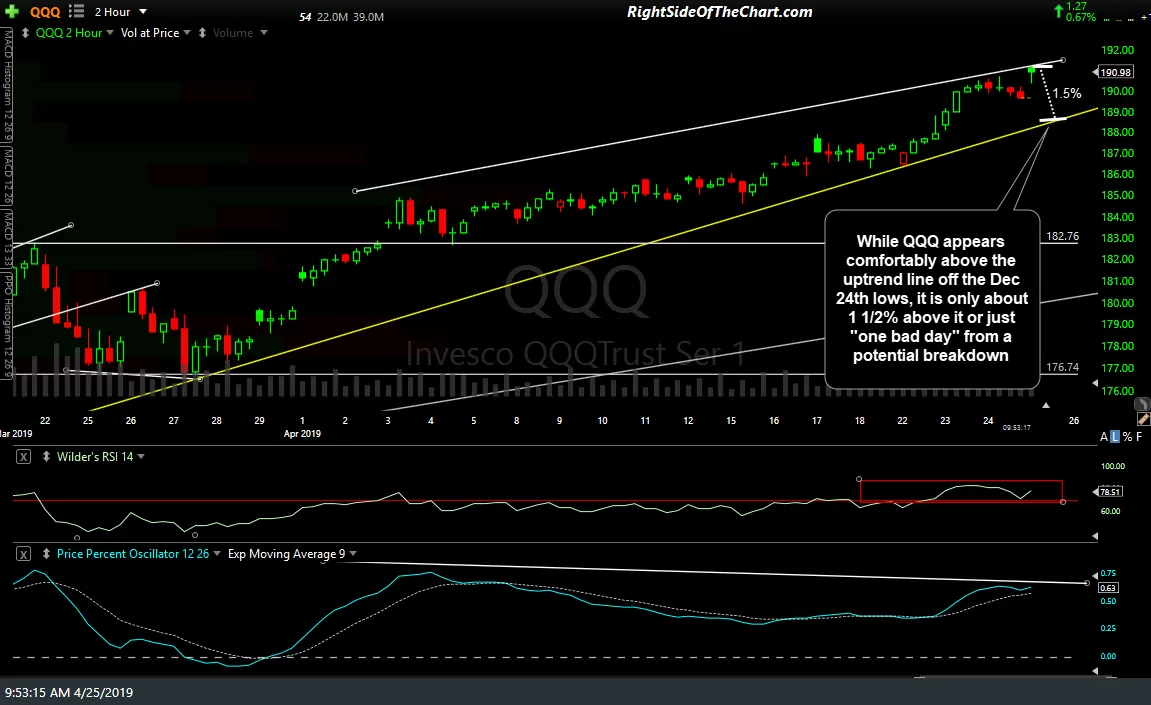
While QQQ appears comfortably above the uptrend line off the Dec 24th lows, it is only about 1 1/2% above it or just “one bad day” from a potential breakdown. 120-min charts:
-
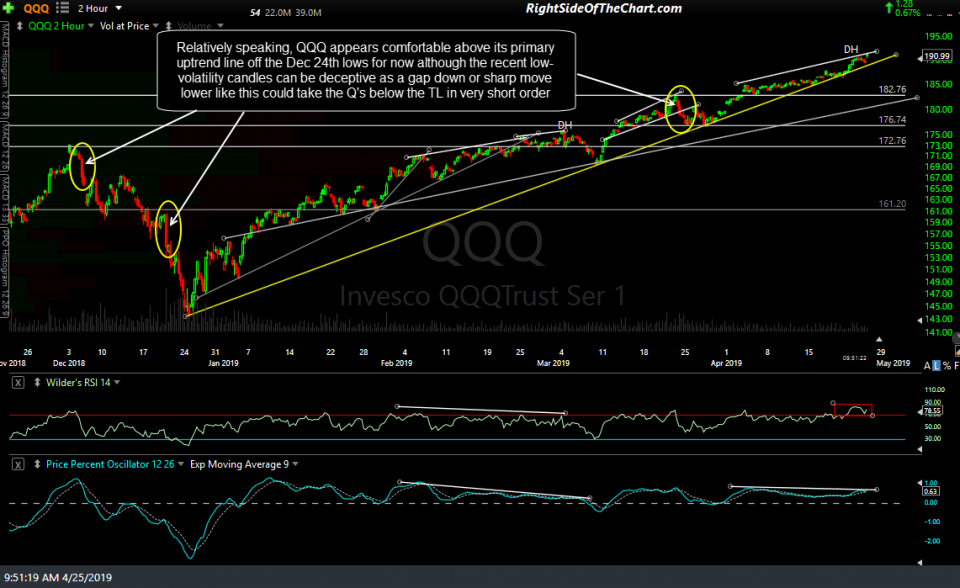
- QQQ 120-min April 25th
-
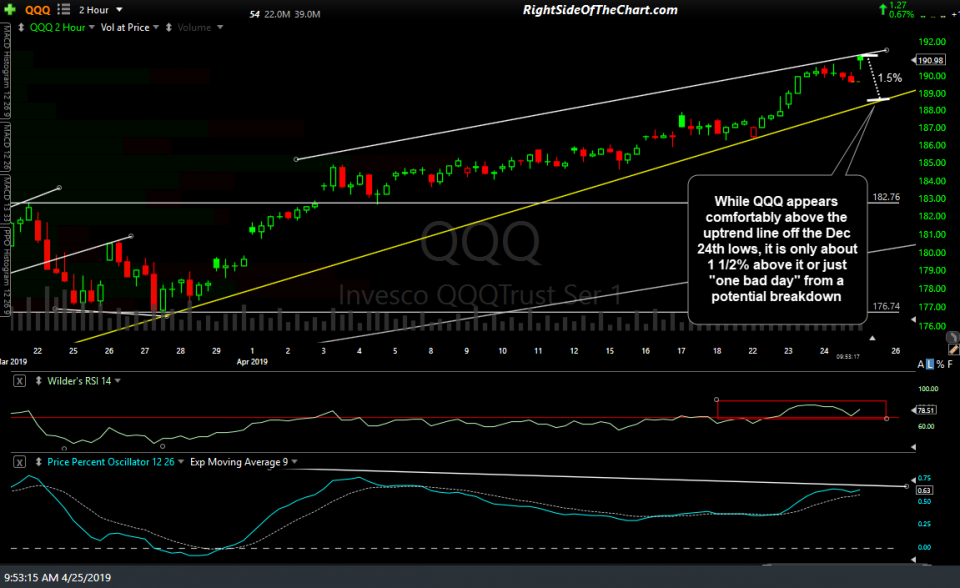
- QQQ 120-min 2 April 25th
-
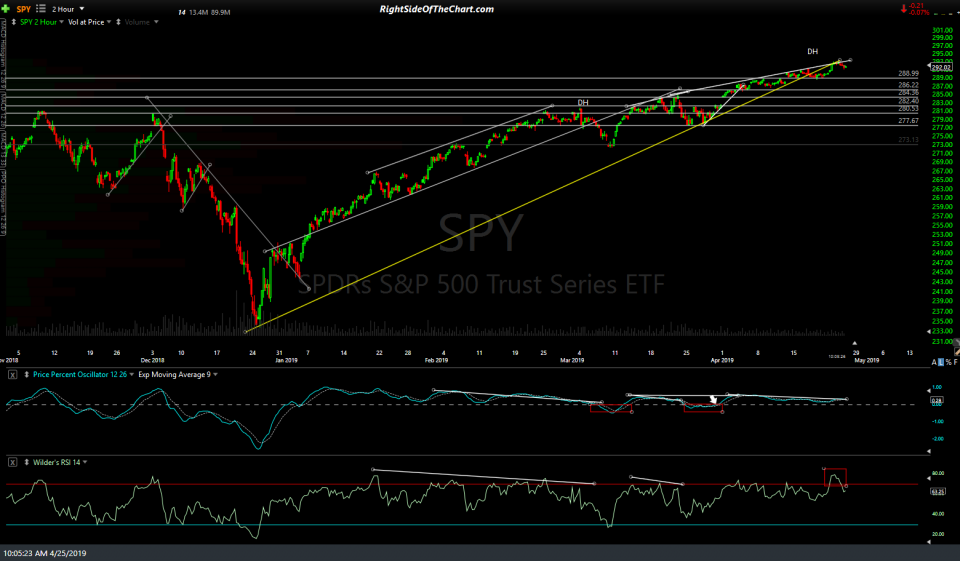
- SPY 120-min April 25th
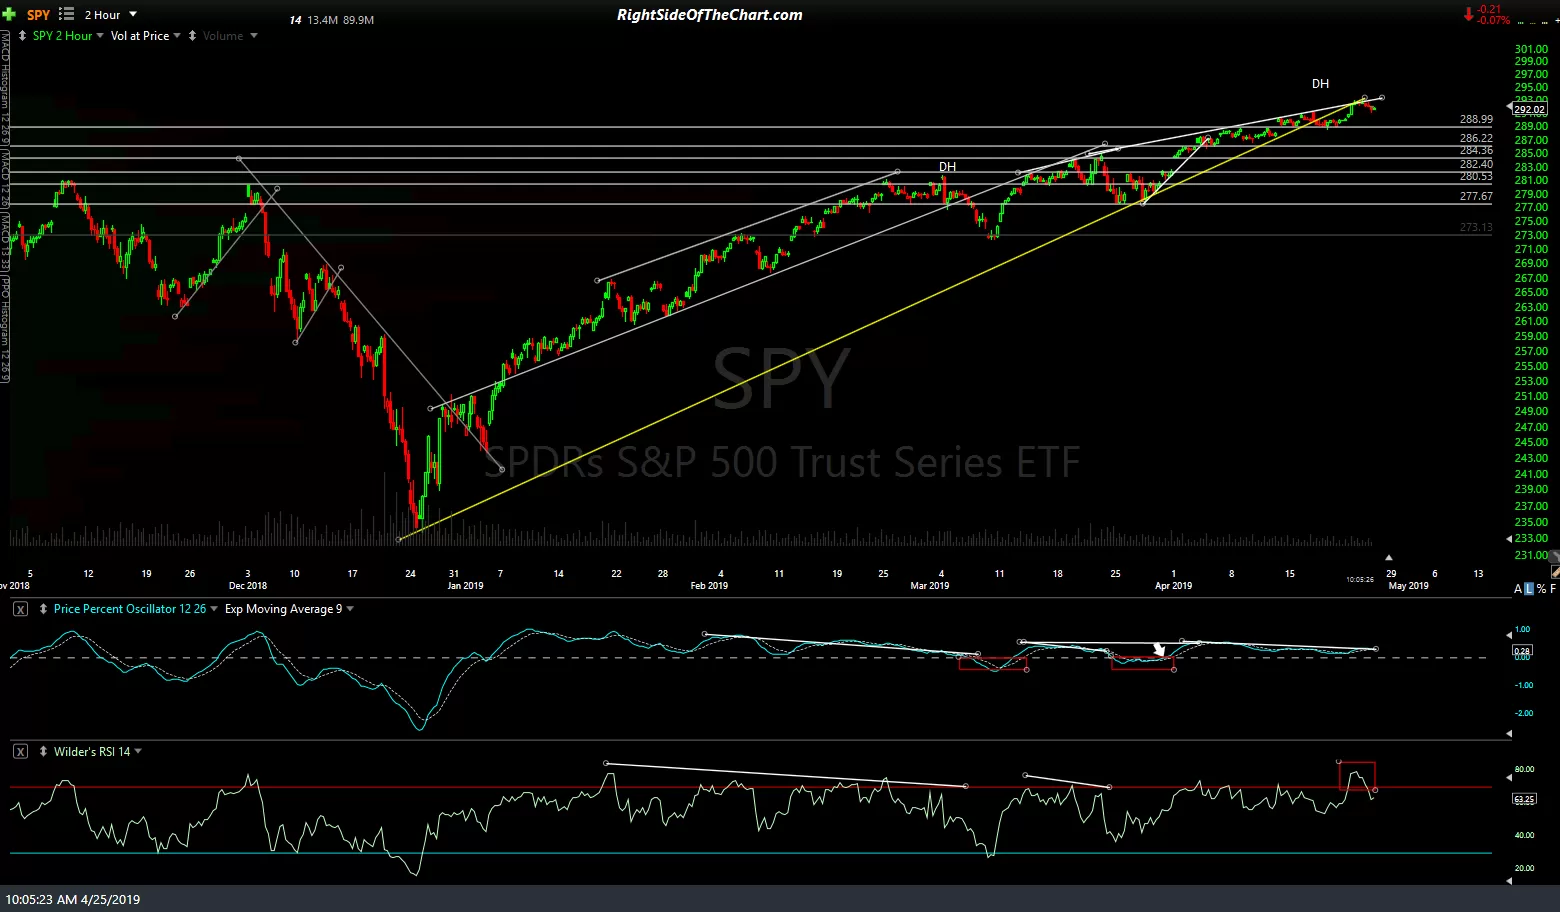
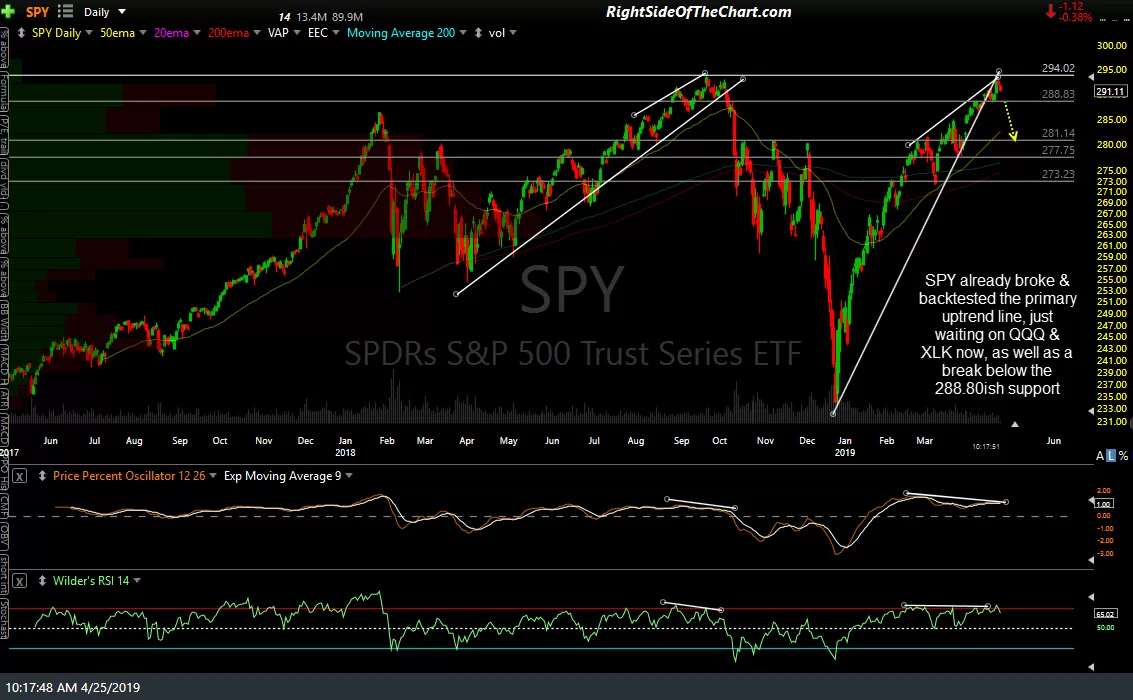
SPY already broke & backtested the primary uptrend line, just waiting on QQQ & XLK now, as well as a break below the 288.80ish support. Daily charts:
-
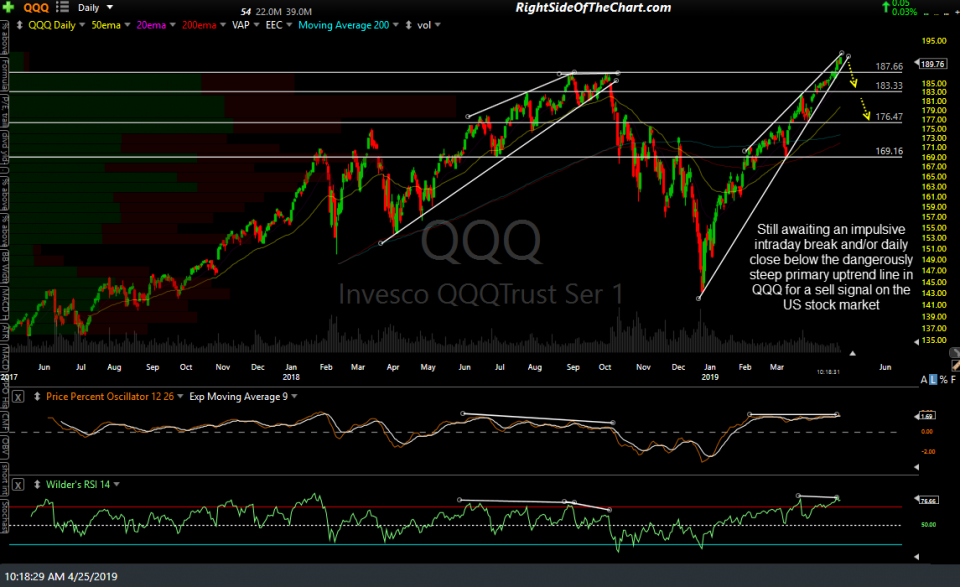
- QQQ daily April 25th
-
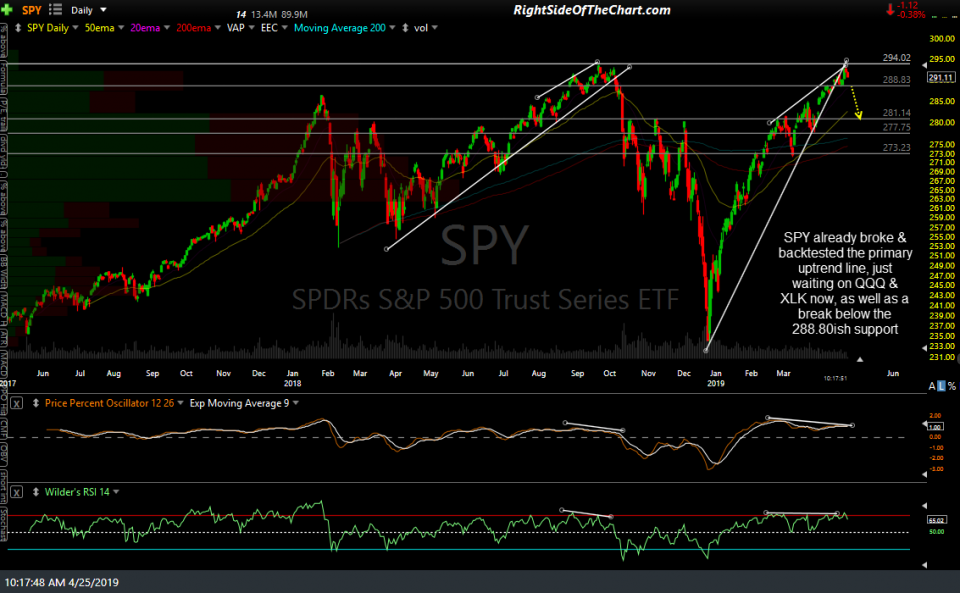
- SPY daily April 25th