
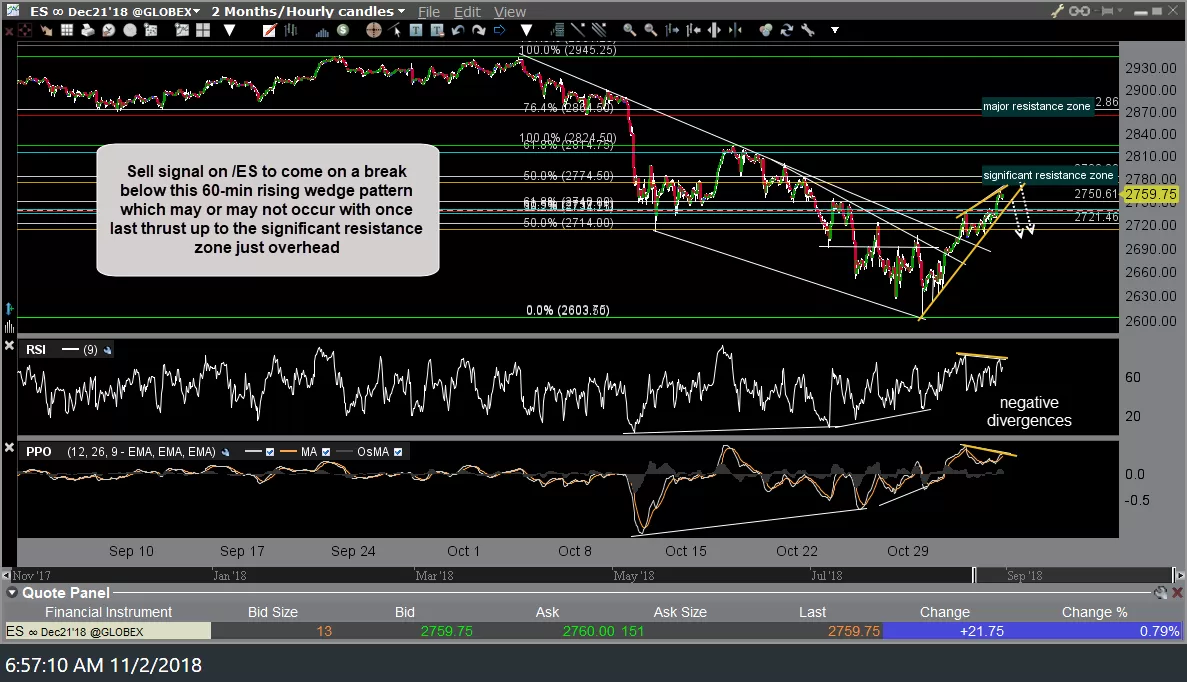
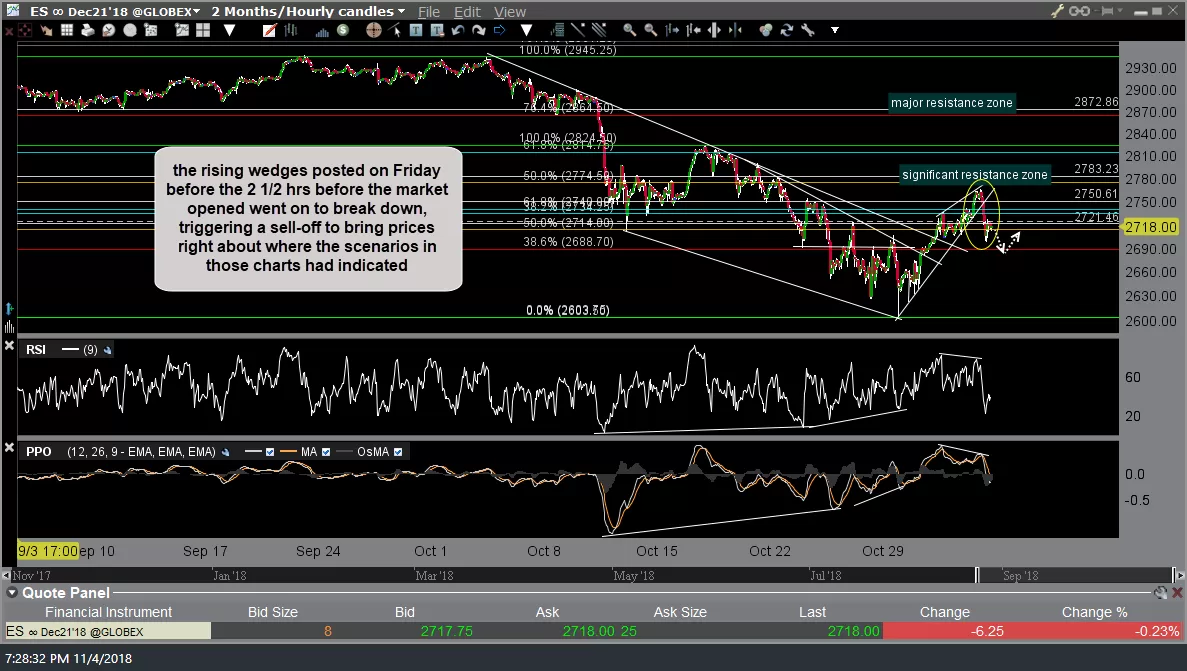
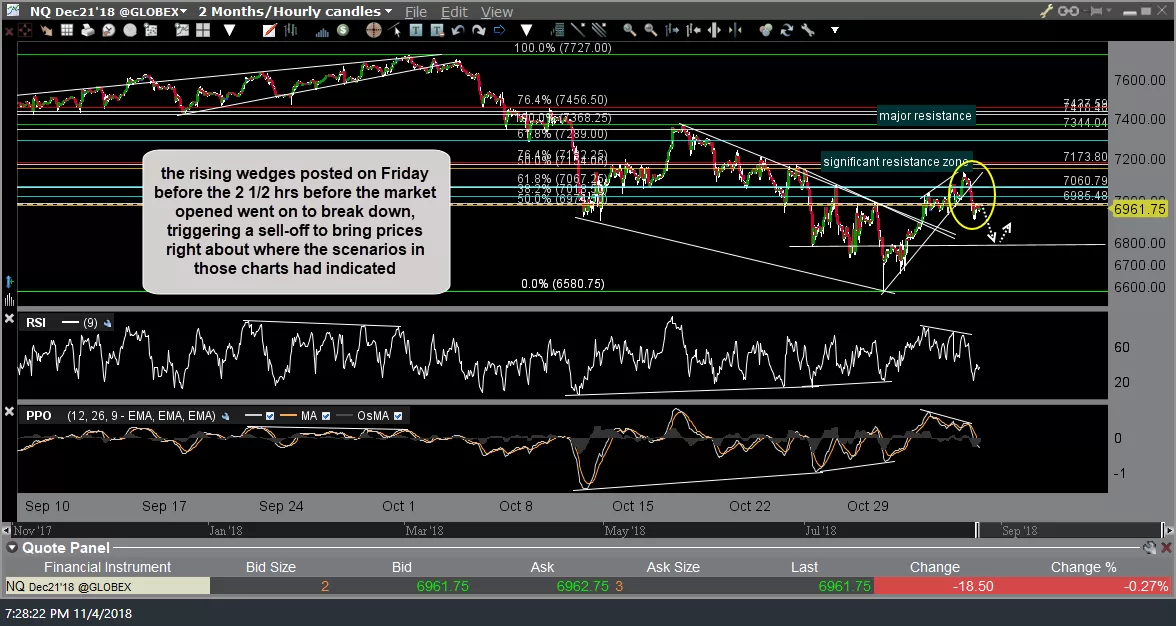
The bearish rising wedge patterns posted on Friday morning before the 2½ hrs before the market opened went on to break down after a little more upside towards the bottom of the resistance zones, triggering a sell-off to bring prices right about where the scenarios in those charts had indicated. Friday’s & tonight’s updated /ES (S&P 500 E-mini futures) & /NQ (Nasdaq 100 E-mini futures) charts below.
-
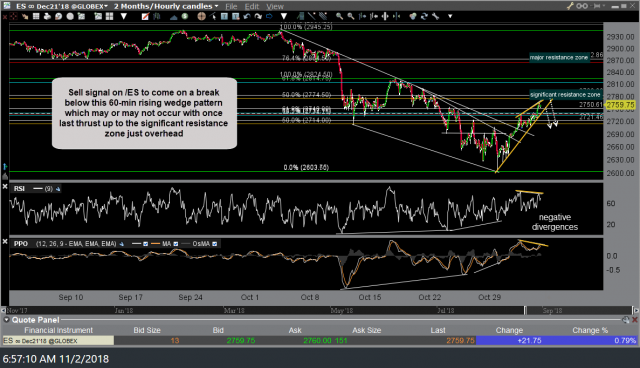
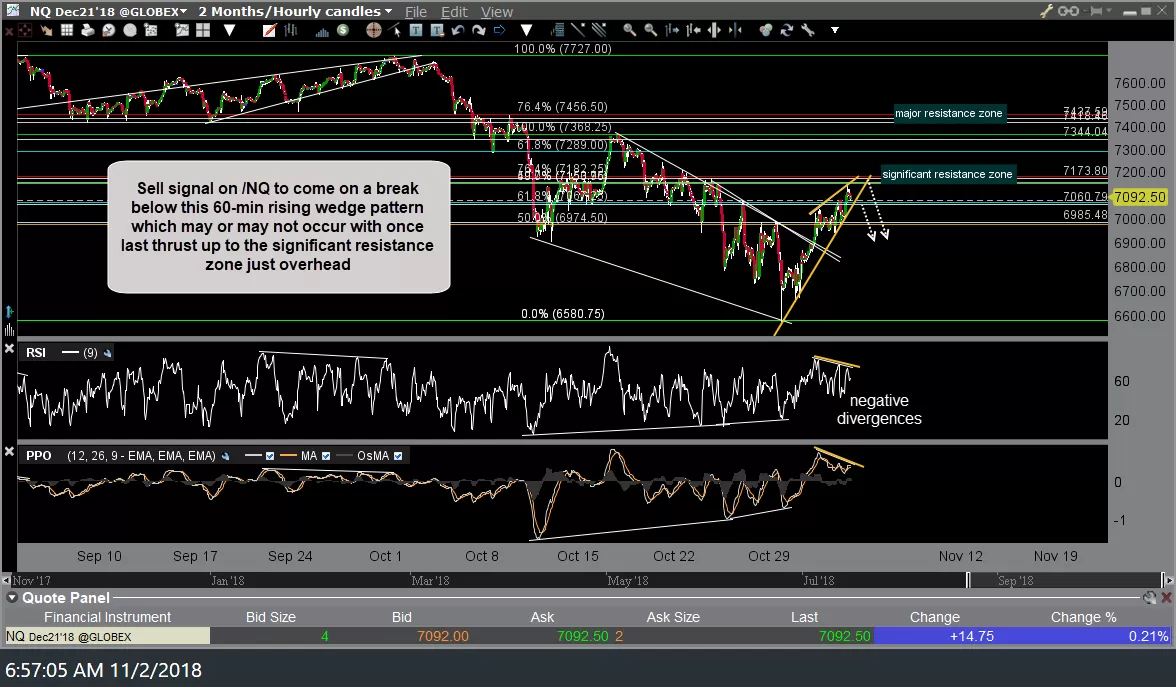
- ES 60-min Nov 2nd
-
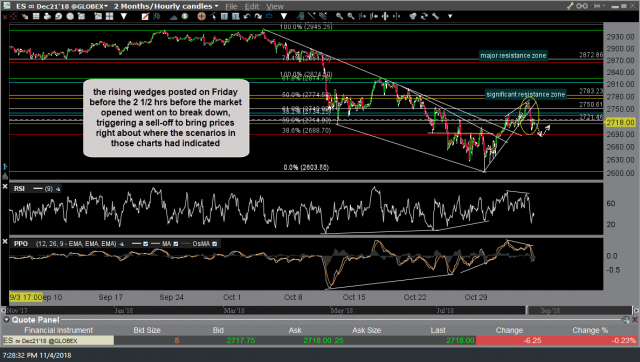
- ES 60-min Nov 4th
-
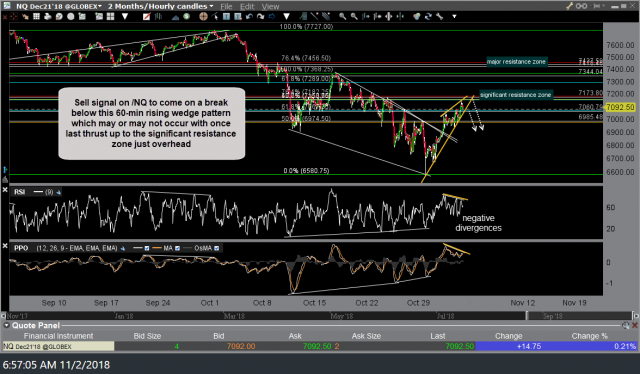
- NQ 60-min Nov 2nd
-
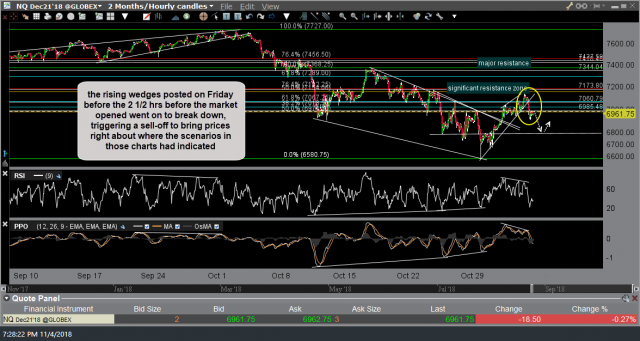
- NQ 60-min Nov 4th
Note: The 4 charts above are attached in a gallery format & may require viewing this post on the site if they do not show on the email notification. Click on the first chart to expand, then click on the right of each chart to advance to the next chart
Following the impulsive move down after the index futures reversed off the support zones & went on to break down below the wedges, the indexes consolidated a before the end of Friday’s trading session to form what appears to be a bear flag continuation pattern on /ES & its close cousin, the bearish pennant continuation pattern on /NQ.
-
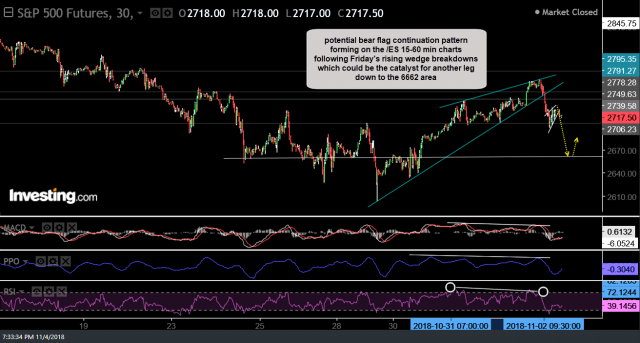
- ES 30-min Nov 4th

-
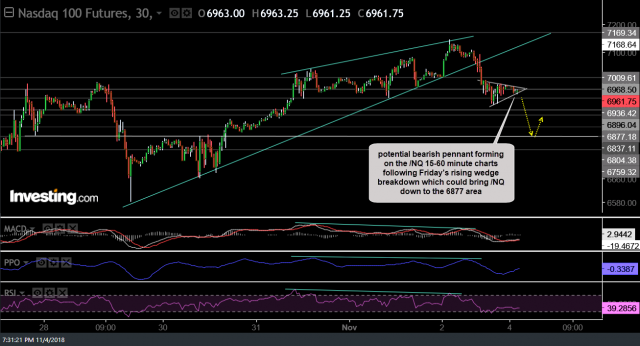
- NQ 30-min Nov 4th

While an impulsive break below both of these flag/pennant patterns would trigger a sell signal, it should be noted that the Sunday night & early Monday overnight trading session is often plagued with whipsaw signals due to the relatively low trading volumes. As such, those looking to trade a short on /NQ or /ES might consider a stop not too far above the top of the recent consolidation levels (pennant & flag) in those futures contracts, as those large-cap indexes did fall to & successfully held support around Friday’s lows (the tops of last Wednesday’s gaps).
I’d still like to see how the markets open & trade tomorrow before deciding whether or not to add back any of the recent swing short trades or any new trade ideas, long or short, that are highly correlated with the stock market. I do plan on posting some analysis & trade ideas on select commodities tomorrow but for now, the very near-term direction of the market isn’t very clear IMO although that could change as early as tomorrow.