
Starting with the daily charts, as impressive as today’s reversal & intraday swing in QQQ was, nothing has changed on the longer-term charts. QQQ continues to wedge higher with the negative divergences still in place on the momentum indicators.
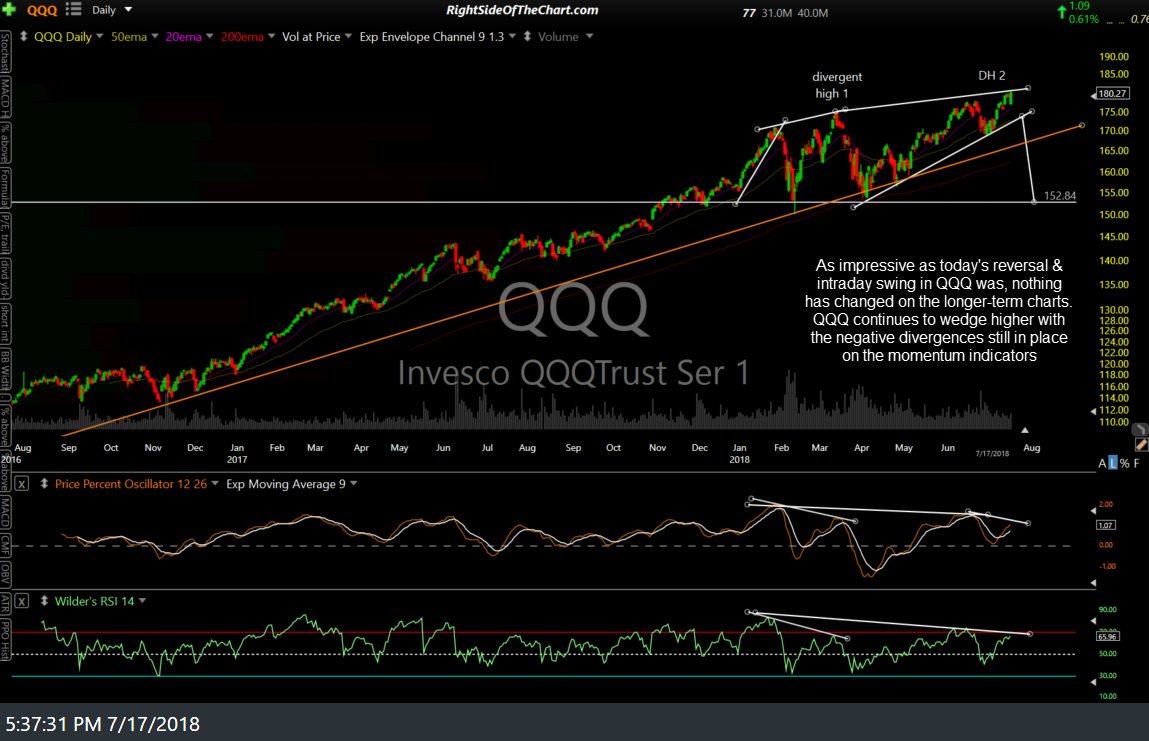
QQQ daily July 17th
SPY made an unconvincing attempt at taking out the key 279.80 resistance level today but only managed to close slightly above, essentially another test of that level today with additional upside needed to clearly take it out.
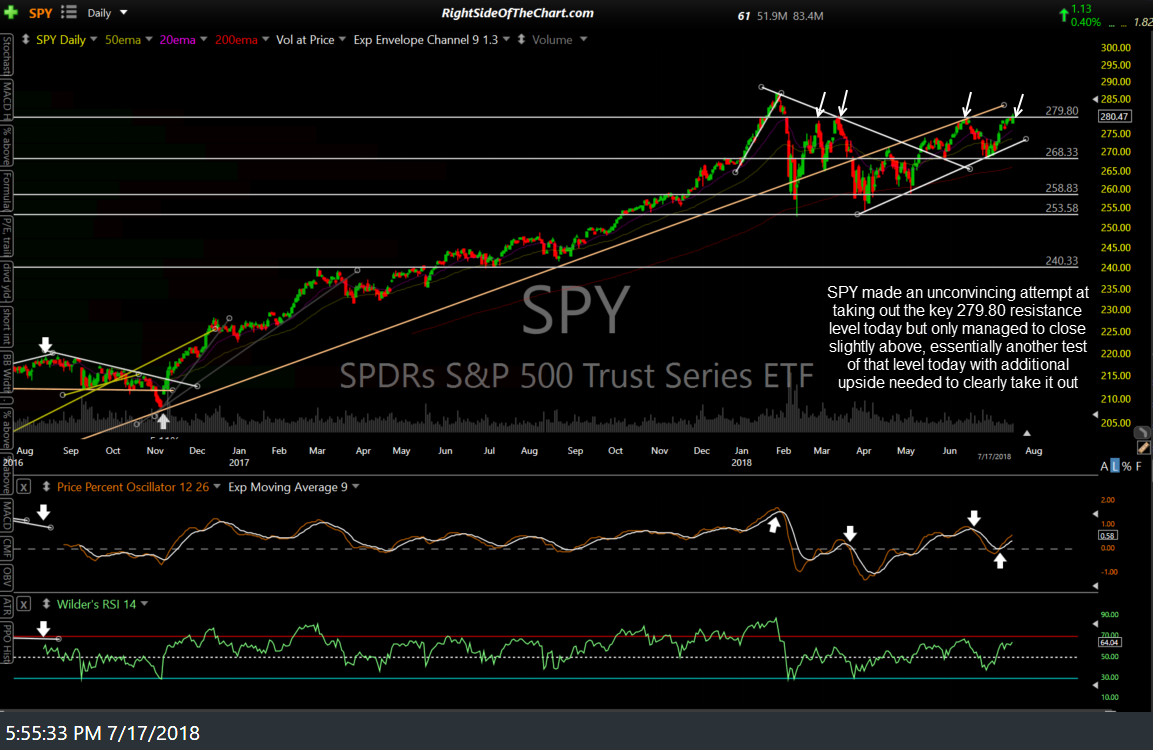
SPY daily July 17th
Zooming down to the 60-minute charts, today’s snap-back rally following yesterday’s bearish rising wedge breakdown took up for a perfect backtest of the wedge from below while keeping the bearish divergences well intact.
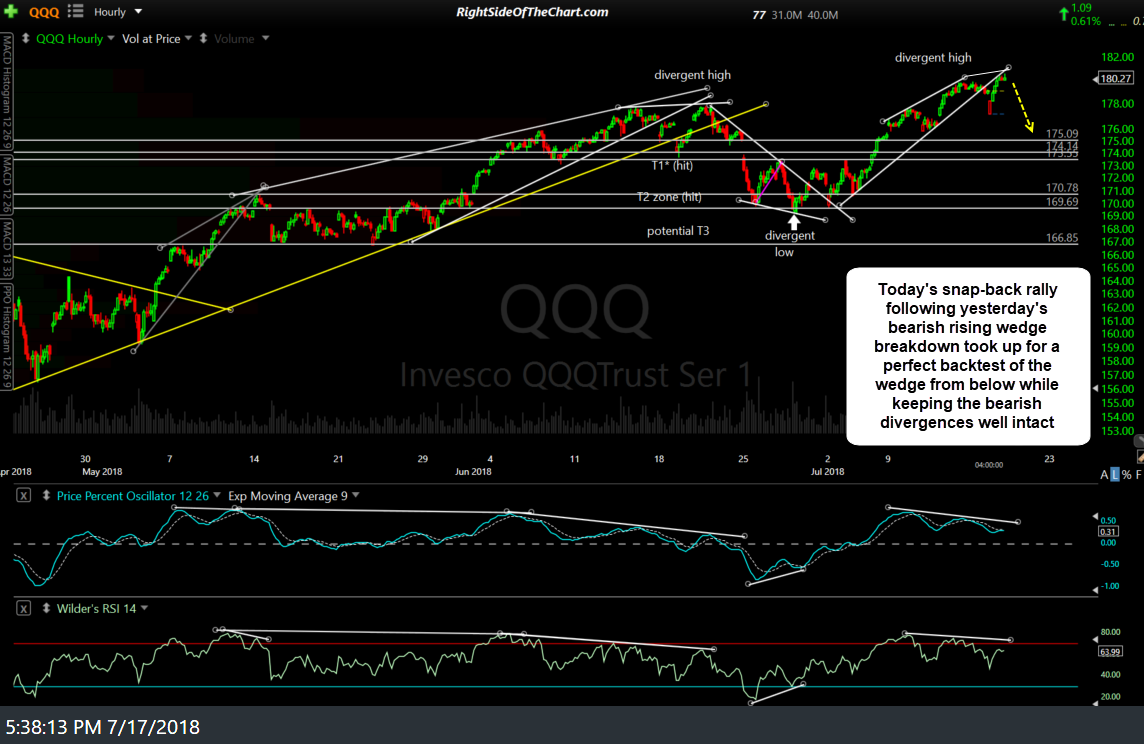
QQQ 60-min July 17th
Likewise, NQ (Nasdaq 100 E-mini futures) stopped cold right at the backtest of the 60-min bearish rising wedge so far today with the negative divergences still well intact.
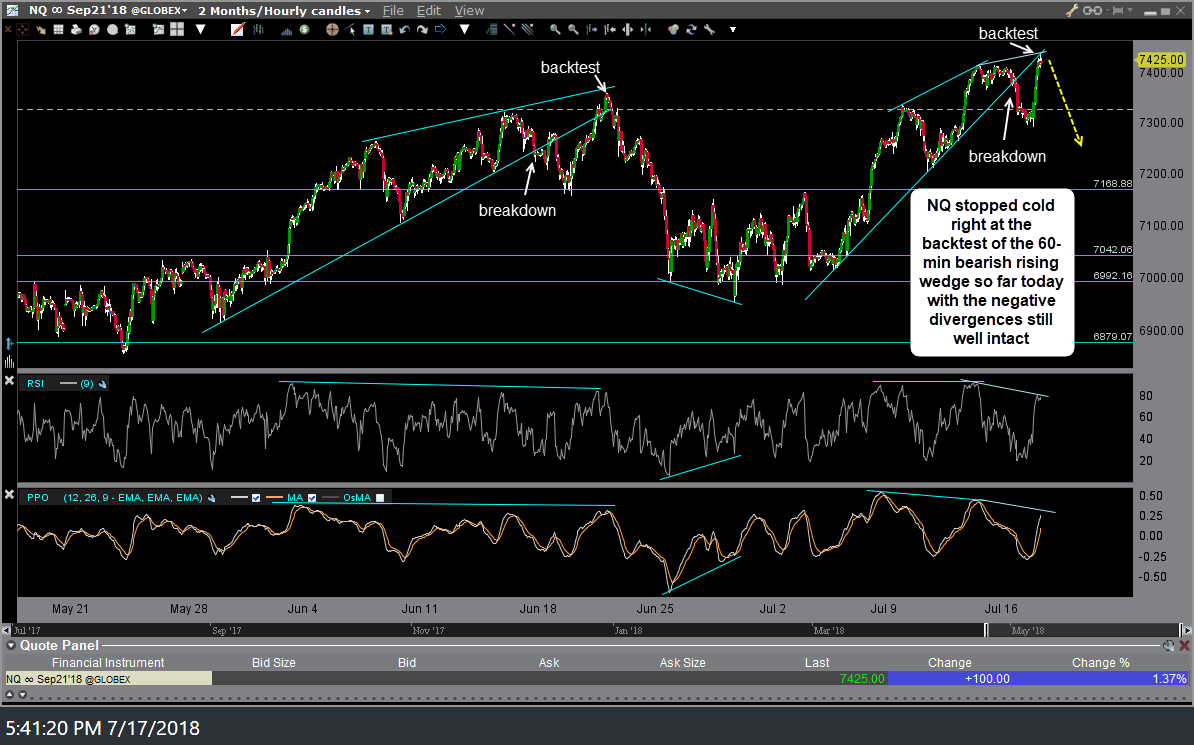
NQ 60-min 3 July 17th
SPY is approaching the ‘sweet spot’ of its 60-min bearish rising wedge pattern where breakdowns typically occur while ES (S&P 500 E-mini futures) stopped just shy of a backtest of the recently broken 60-minute uptrend line so far today with the negative divergences still well intact.
-
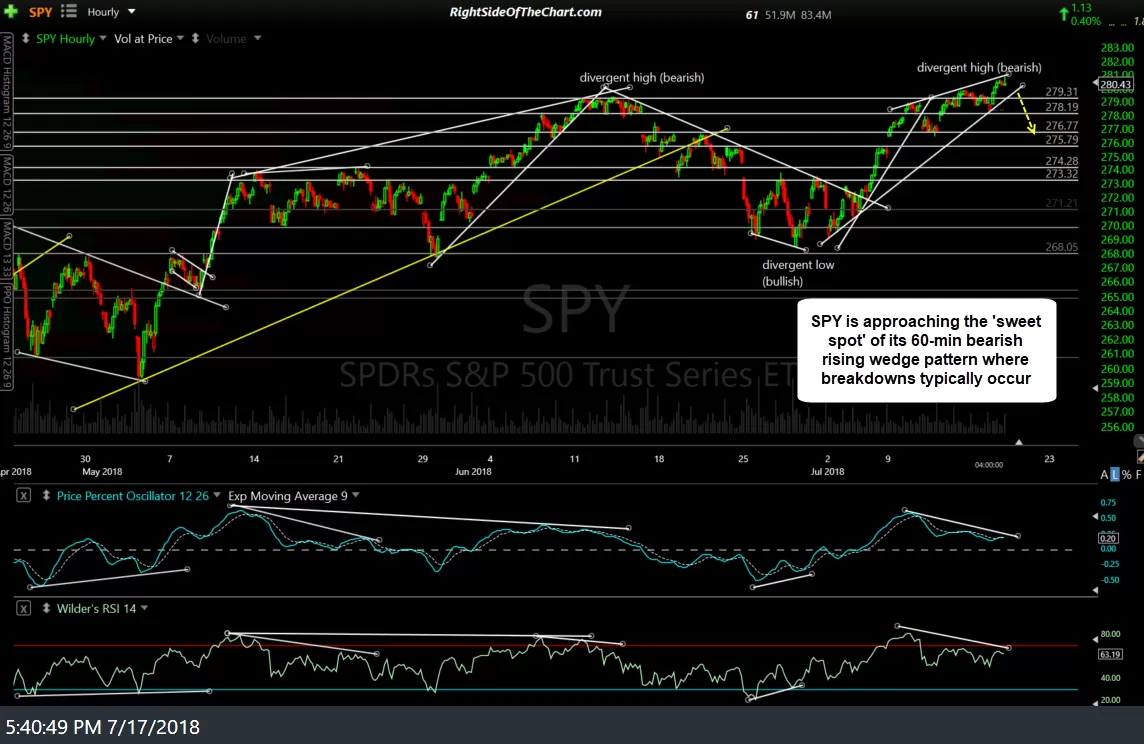
- SPY 60-min July 17th
-
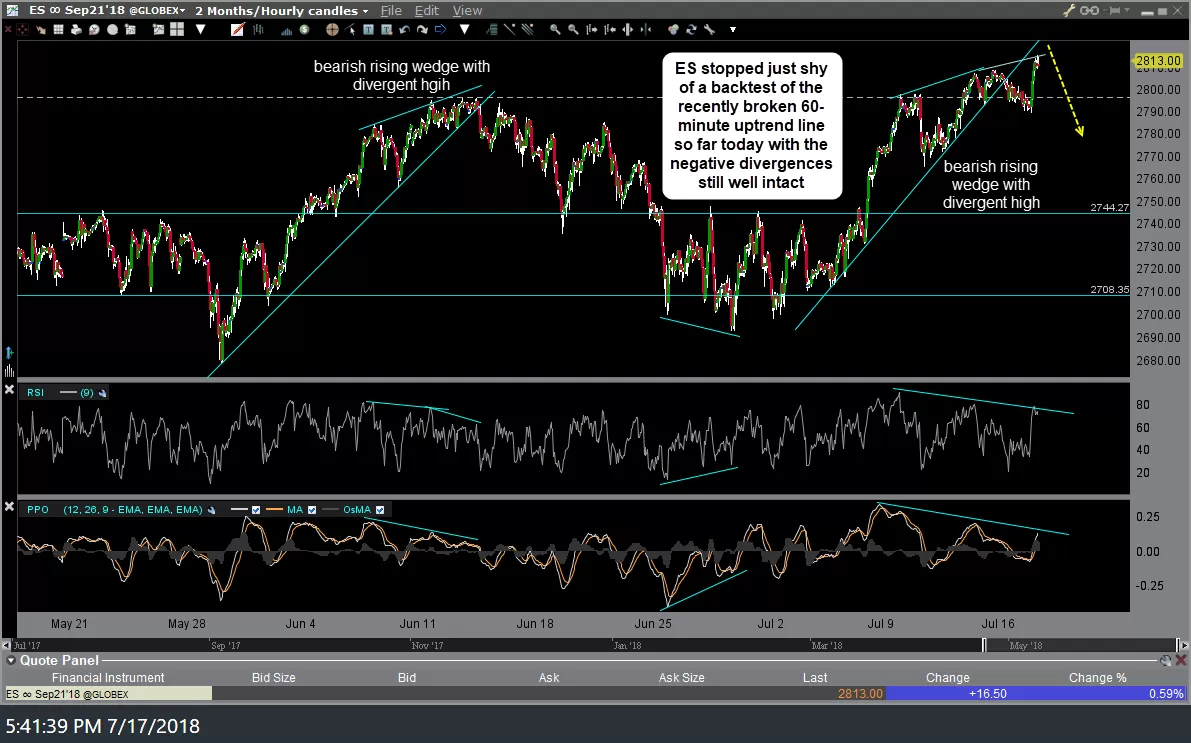
- ES 60-min July 17th
Essentially, the bearish divergences on both the 60-minute chart as well as the daily charts remain intact for now as QQQ wedges higher & SPY makes its fourth attempt at the 280ish level so far this year. SPY also has unconfirmed negative divergence on the daily chart from the previous high on June 13th (not drawn on the daily chart above). Should the markets continue to rally substantially from here, those divergences could be taken out but until & unless they are, they indicate that an impending trend change is likely. To be continued tomorrow…