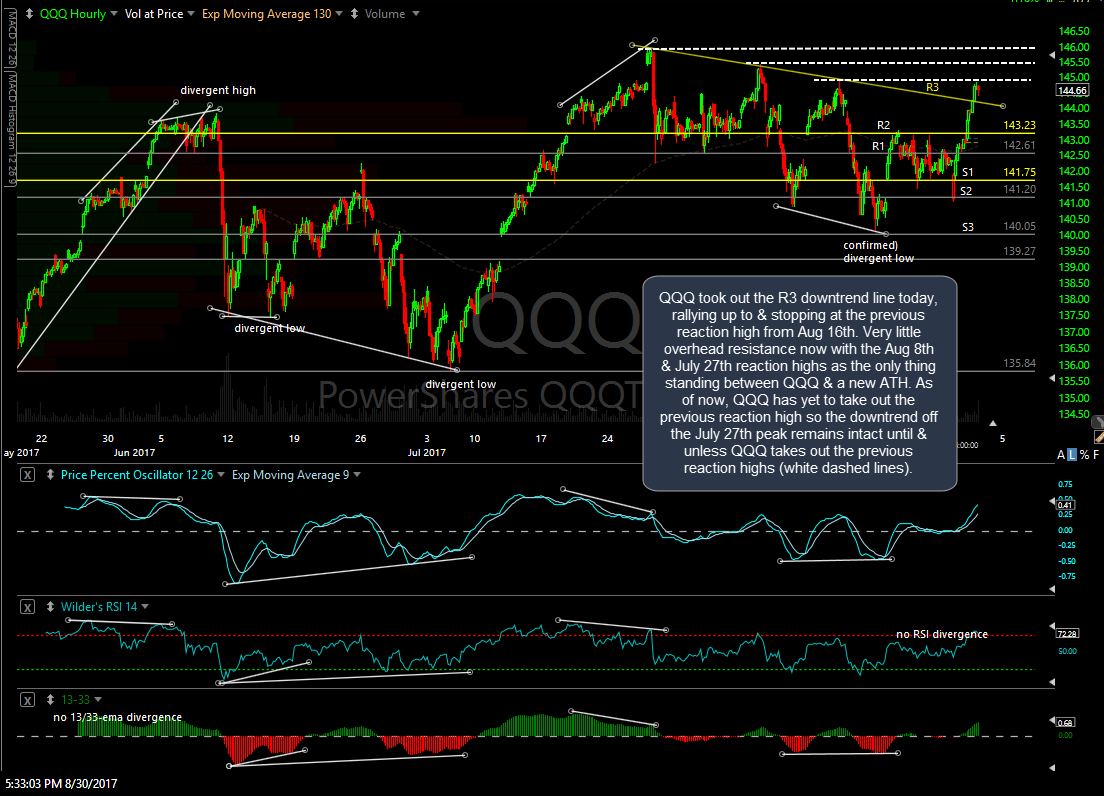
Pardon my absence today in the trading room as well as my lack of updates on the front page. I had a repair technician troubleshooting a spotty internet connection for nearly all of the day today. After reviewing the charts of the US stock indices now that I’m back online, there are a few things that stand out today worth highlighting. Starting with the QQQ 60-minute chart, the Q’s took out the R3 downtrend line today, rallying up to & stopping at the previous reaction high from Aug 16th. Very little overhead resistance now with the Aug 8th & July 27th reaction highs as the only thing standing between the Nasdaq 100 & a new all-time highs. Keep in mind that the Q’s have yet to take out the previous reaction high, falling a few cents shy today, so the downtrend off the July 27th peak still remains intact until & unless QQQ takes out the previous reaction highs (white dashed lines).
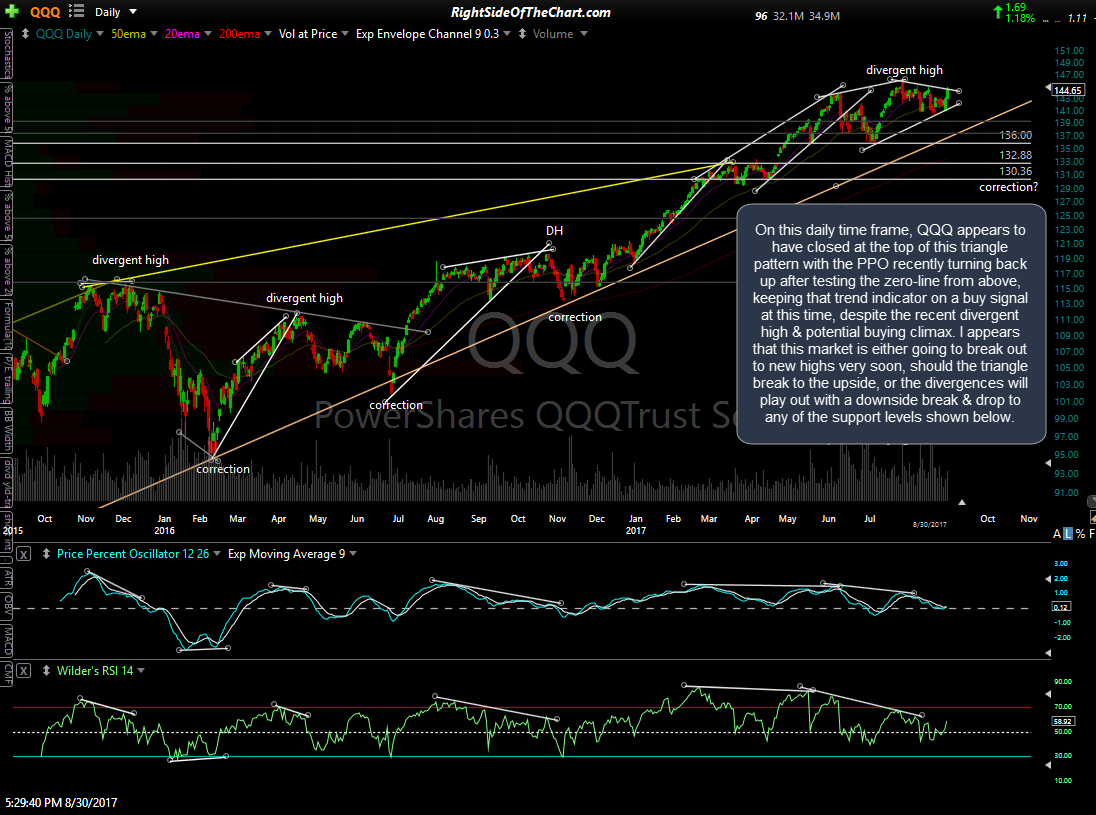
On this daily time frame, QQQ appears to have closed at the top of this triangle pattern with the PPO recently turning back up after testing the zero-line from above, keeping that trend indicator on a buy signal at this time, despite the recent divergent high & potential buying climax. It appears that this market is either going to break out to new highs very soon, should the triangle break to the upside, or the divergences will play out with a downside break & drop to any of the support levels shown below.
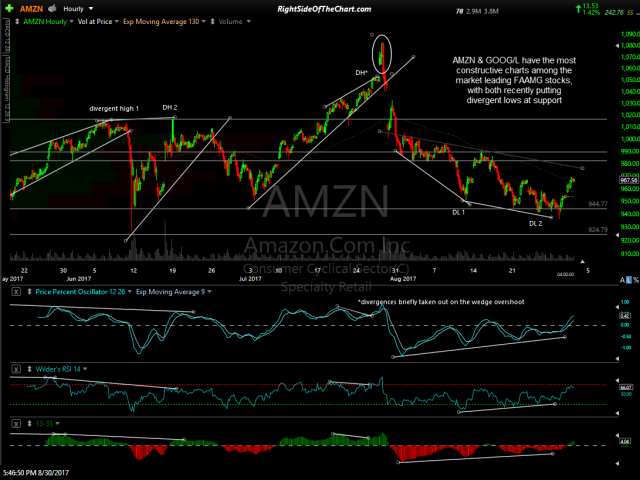
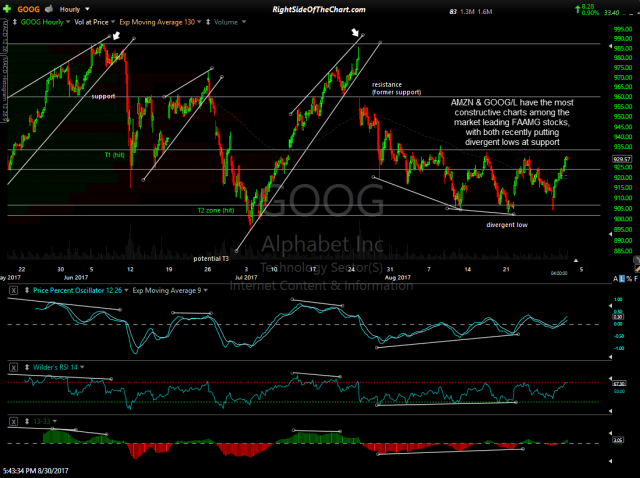
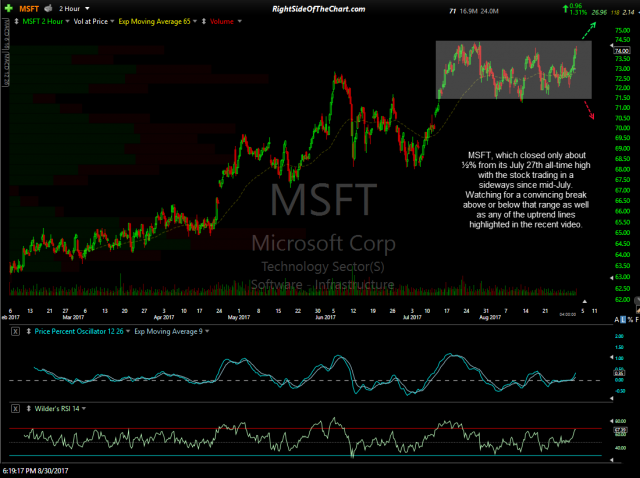
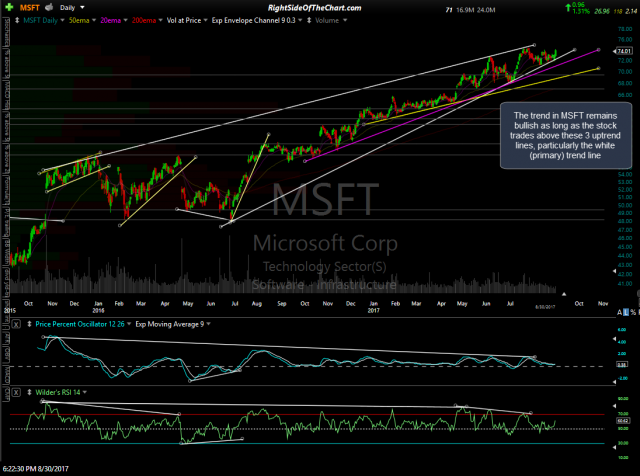
Digging down into the market leading FAAMG stocks, there appears to be a mixed bag of technicals. AMZN & GOOG(L) have the most constructive charts with both recently putting in divergent lows at support. I don’t have much of an opinion on MSFT, which closed only about ½% from its July 27th all-time high with the stock trading in a sideways since mid-July. Watching for a convincing break above or below that range as well as any of the uptrend lines highlighted on the daily chart. As long as MSFT remains above those uptrend lines, the primary trend remains bullish.
- AMZN 60-min Aug 30th
- GOOG 60-min Aug 30th
- MSFT 120-min Aug 30th
- MSFT daily Aug 30th
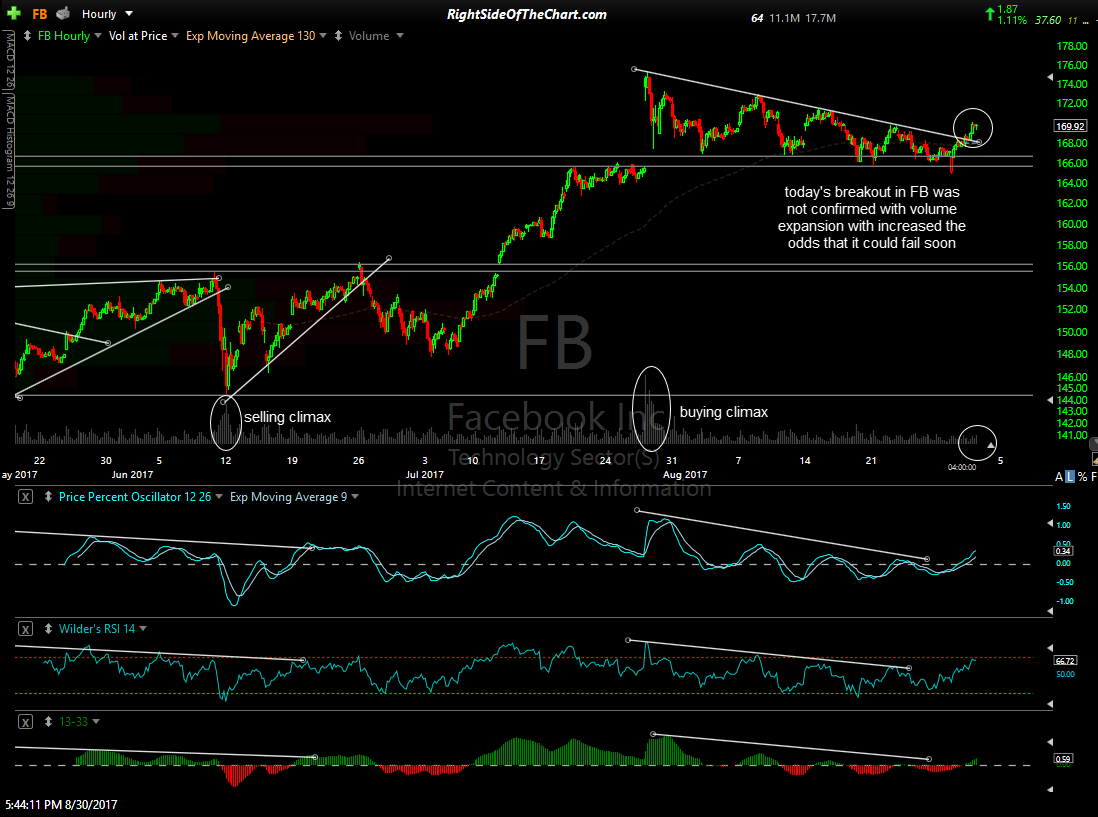
FB managed to breakout & close above the recently highlighted downtrend line/descending triangle pattern although it should be noted that the breakout did not occur on volume expansion. Ideally, bullish breakouts should occur on 1.5x or greater the average volume. Breakouts that occur on low or average volume have an increased rate of failure so I’ll be watching this one closely in the coming sessions.
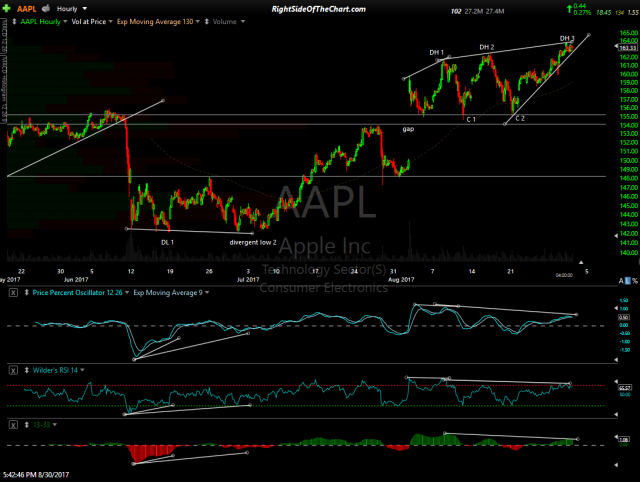
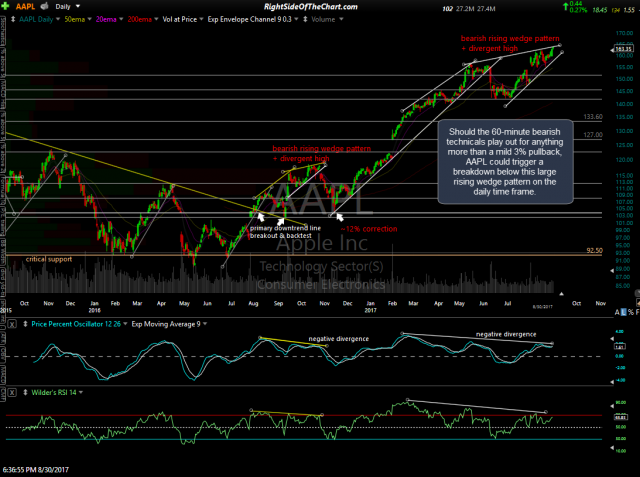
Finally the 800-lb. gorilla, AAPL. While it’s hard to make a bearish case on a stock trading at or just off all-time highs, I will say that the largest component of both the Nasdaq 100/QQQ, as well as the S&P 500/SPY, looks poised for a correction with a sell signal to come on a break below this 60-minute uptrend line/bearish rising wedge pattern. While normally I wouldn’t expect anything more than a relatively shallow & short-lived pullback from the break below such a small pattern on the 60-minute time frames, particularly with the primary uptrend still bullish, Apple is also sitting precariously close to the bottom of a much larger bearish rising wedge pattern on the more significant daily time frame. As such, a break of this smaller 60-minute wedge could be the catalyst for a drop that triggers a more powerful sell signal on the daily time frame. Something to monitor IMO as a correction in AAPL would most certainly provide headwinds to the rest of the market.
- AAPL 60-min Aug 30th
- AAPL daily Aug 30th
Bottom line: “The stock market” hasn’t been conductive to swing trading for months now, with the large cap indices (SPY & QQQ) trading less than 1% above where they closed back on June 2nd, 3 months ago, and the small caps trading below where they closed back on December 9, 2016, a sideways grind going nowhere for nearly 9 months now. The most lucrative & least frustrating trading opportunities continue to be found in the sectors & individual stocks with the most bullish & bearish technicals. While the broad market has been grinding sideways, there has been a tremendous amount of sector rotation & as long as that continues, this will remain a stock-pickers market.


