
Here’s a quick glance at the near-term outlook for the U.S. equity markets on a few of the major index tracking ETFs:
Barring this one brief dip below, SPY has traded sideways in a tight range since breaking down below the 60-minute uptrend line with a divergent high in early Dec. While a solid & sustained break above the top of the range around 228.20 would be bullish, I favor a downside break of the bottom of the range around 224.85 which is likely to bring SPY down to any or all of the support levels shown on this 60-minute chart.
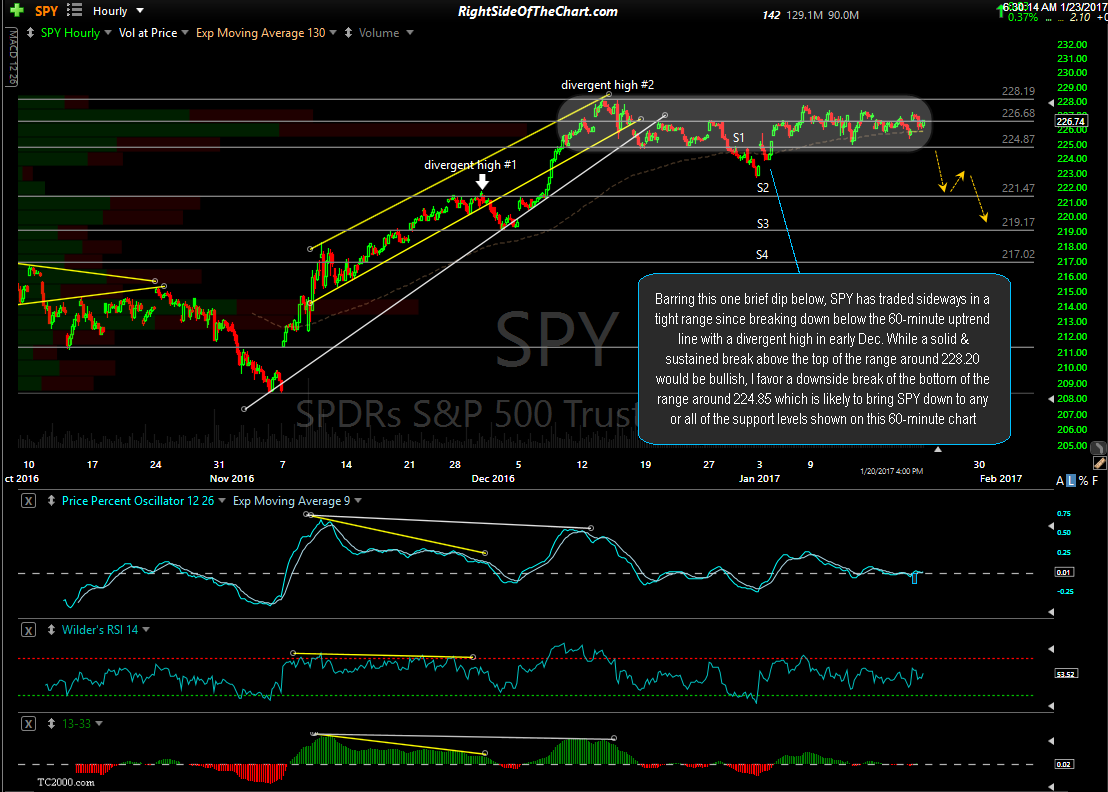
SPY 60-min Dec 20th close
My preferred scenario is for QQQ to break down below this minor uptrend / support line, followed by a move down to the 121.60ish level followed by a brief reaction & then a continued move down to at least the 119.50 support level / larger uptrend line.
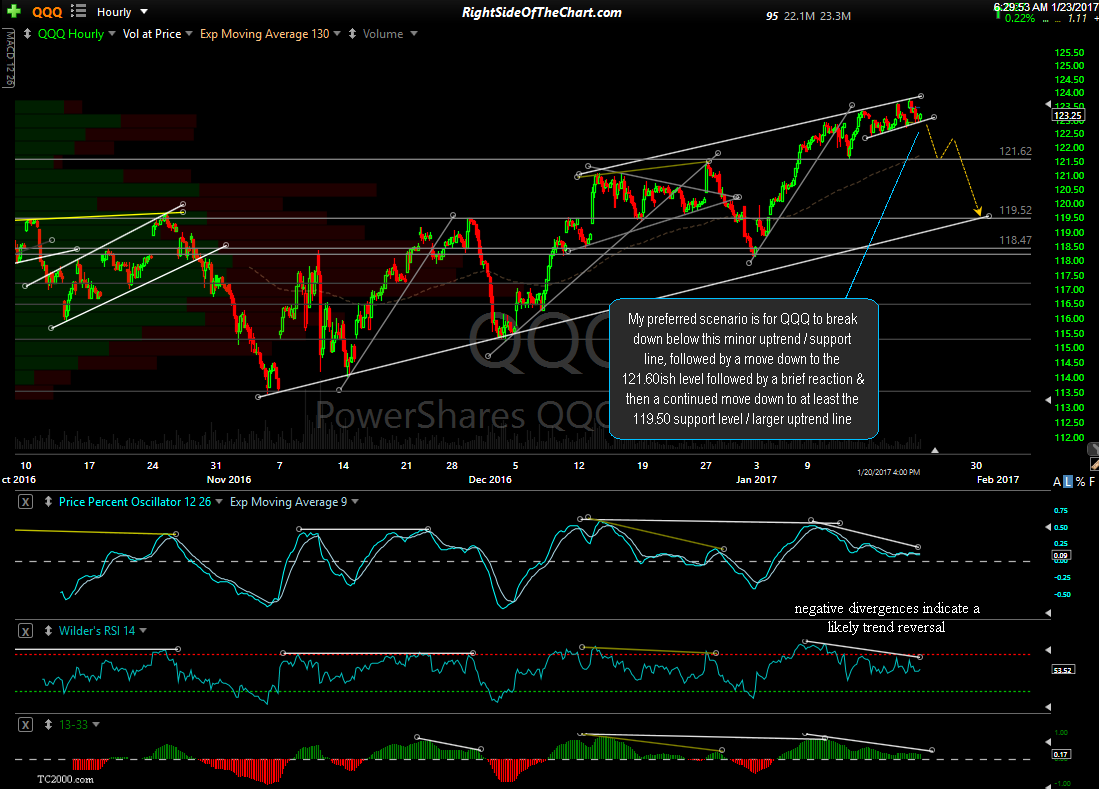
QQQ 60-min Dec 20th close
Following the bearish rising wedge breakdown in early Dec, IWM traded in a very tight sideways range for about 5 weeks & has started to slip down below the bottom of the range with a downside resolution likely. Potential targets shown on this 60-minute chart.
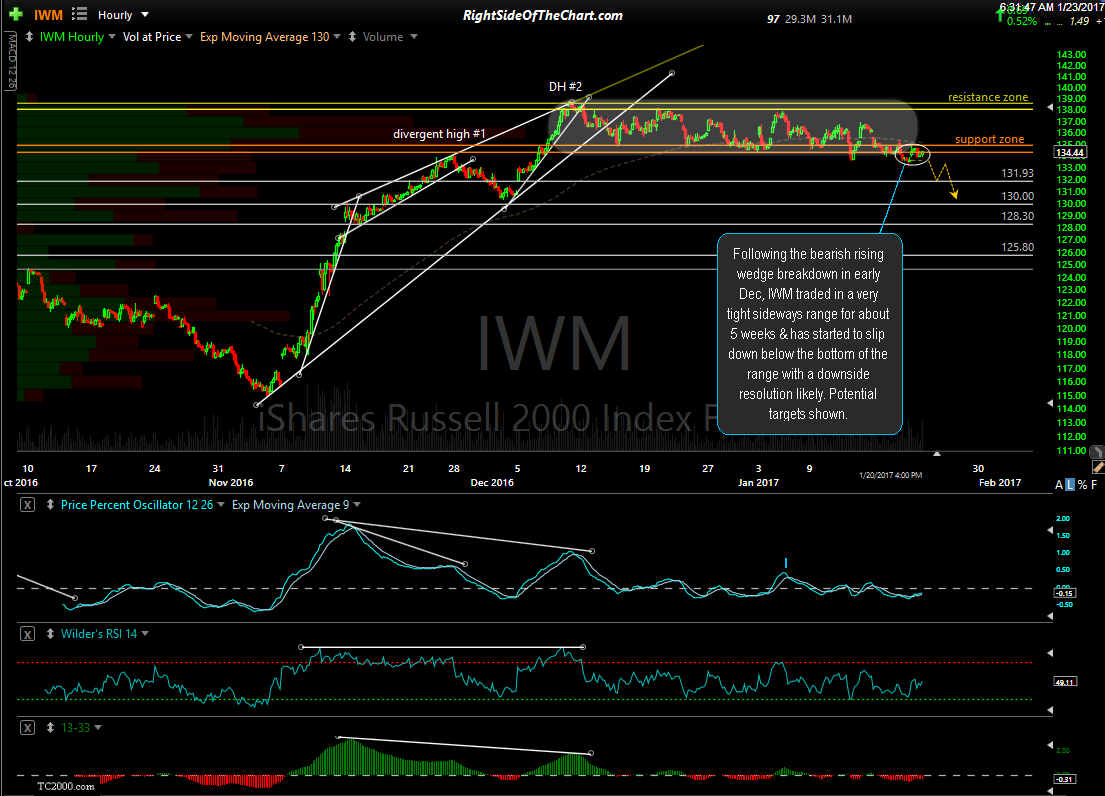
IWM 60-minute Jan 20th close