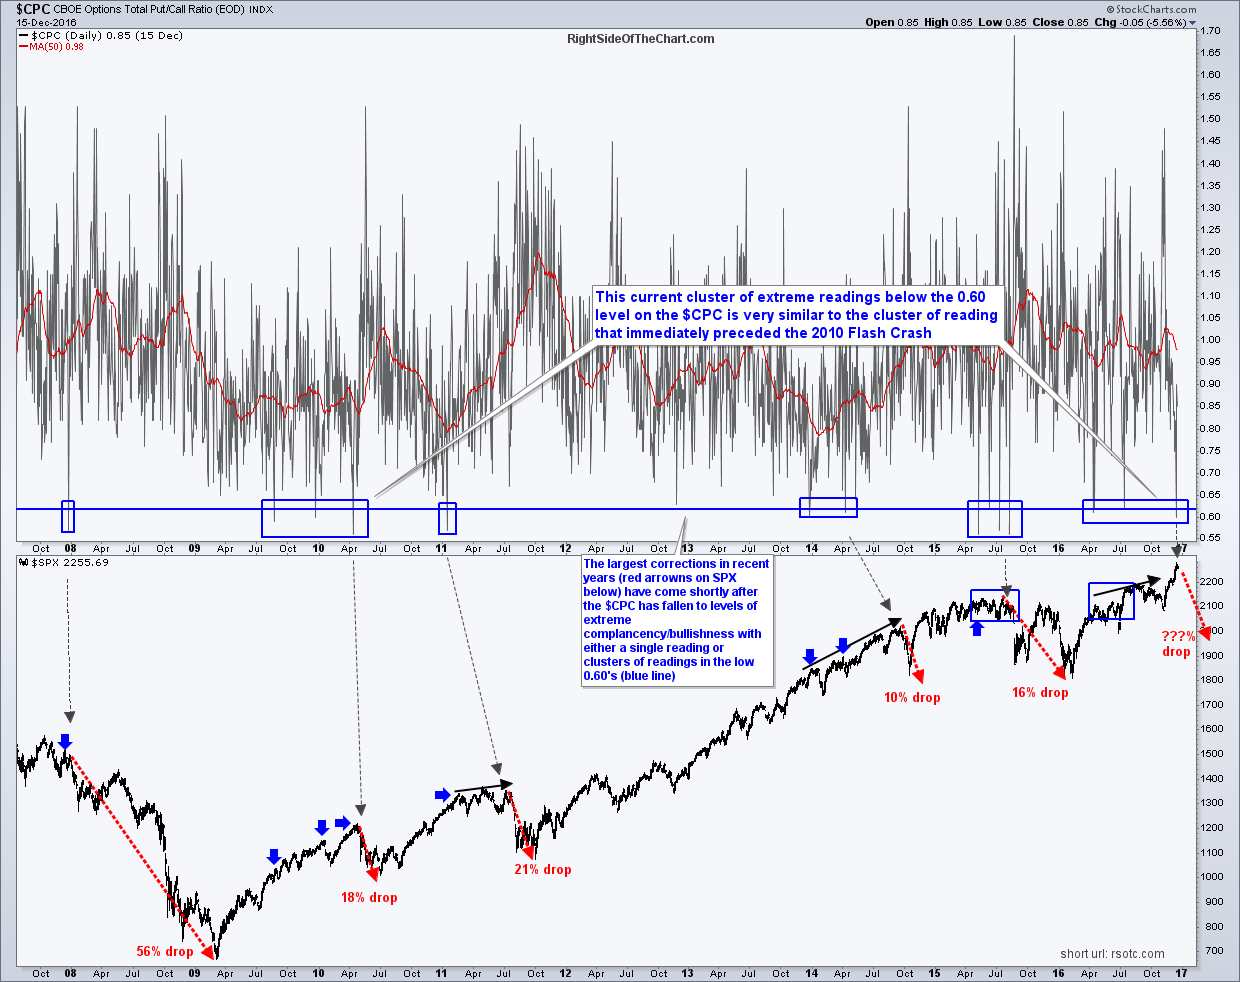
One of my favorite indicators for identifying potential corrections in the stock market has just triggered the 4th extreme reading of below 0.60 on the Put-to-Call Ratio in what I refer to as a cluster of readings (a series of sub 0.60 readings that occur in relative close proximity without a substantial correction while the stock market is moving higher with each successive reading).
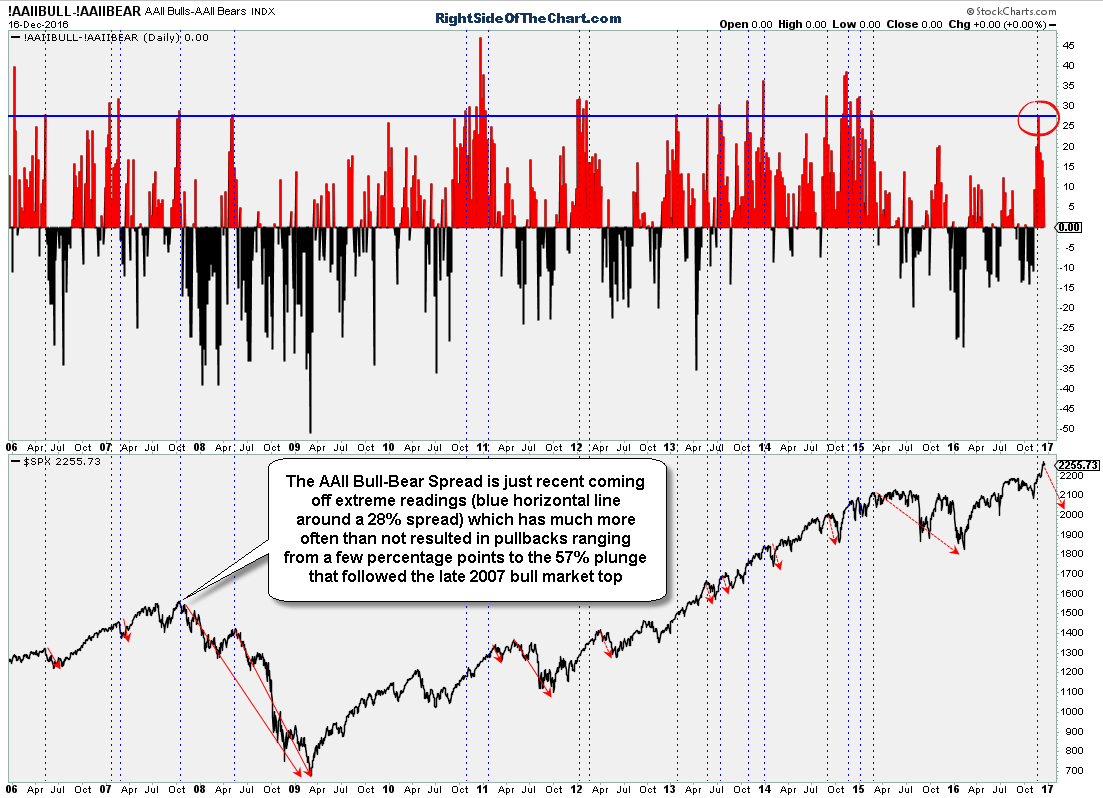
The Put-to-Call ratio is a sentiment indicator which is calculated by dividing the number of traded put options by the number of traded call options. Like most sentiment indicators, this is a contrarian indicator, meaning that it can often help indicate when the chances of major rally or correction in the stock market are elevated by gauging extreme bullish or bearish sentiment among market participants. Additional evidence of extreme bullish sentiment can be found in the American Association of Individual Investors (AAII) sentiment survey which is just recent coming off extreme readings (blue horizontal line around a 28% spread). Such extreme bullish sentiment has much more often than not resulted in pullbacks ranging from a few percentage points to the 57% plunge that followed the late 2007 bull market top as shown in the chart below.
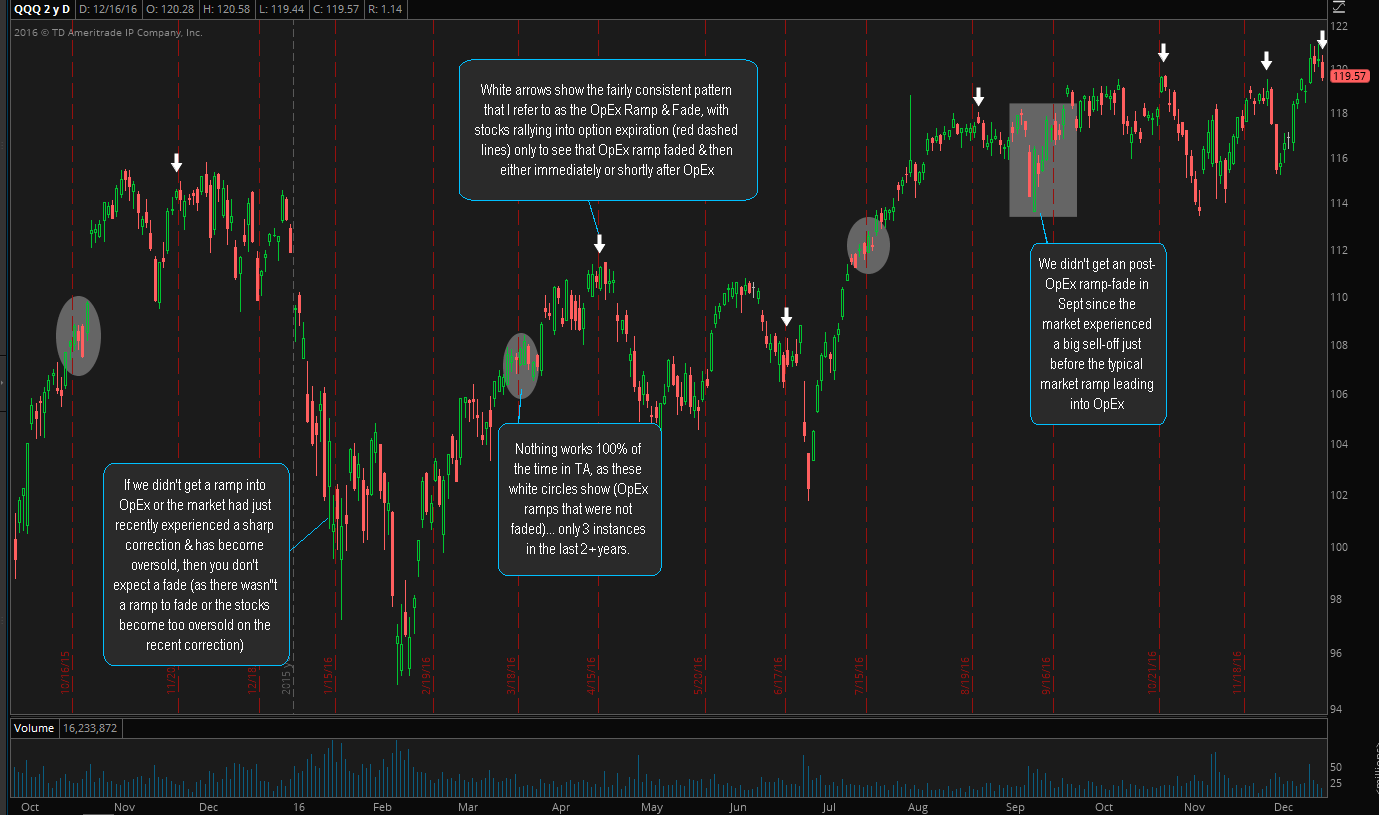
Finally, I would be remiss not to point out the fact that today is standard options expiration (OpEx). For years now, I’ve highlighted a fairly consistent pattern in the stock market that I refer to a the OpEx ramp, which is the tendency for the stock market to rally leading into the third Friday of each month (OpEx), only to see that rally often faded & then some either immediately or shortly after OpEx.
Bottom line: Despite what might seem to some as an unstoppable rally, based on the charts above coupled with the bearish technical developments from the 60-minute charts all the way out to the weekly time frames, the risk/reward in the stock market, at least for the next week or so, appears to be skewed towards the downside.


