Yesterday I had highlighted that the US equity markets were trading at resistance levels where they were likely to reverse & as such offered an objective short entry at that time. So far that has proved to be the case with the markets immediately reversing from those levels, drifting modestly lower throughout the trading session & into the close yesterday & following through with more impulsive selling so far today. Those support levels were highlighted yesterday on the intraday (60-minute) charts whereas today, we now find the major US stock indices at or slightly below key support levels, uptrend lines and/or horizontal price supports on the more technically significant daily time frames. For those that don’t have time to view the video overview published early today, in which the key levels & technical developments to watch for were covered in detail, here’s a quick snapshot of the salient technical levels & developments which have the potential to trigger the first “swing tradable” downtrend in months.
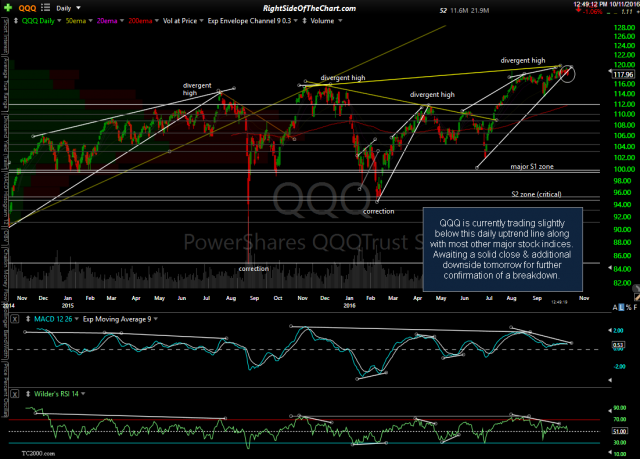
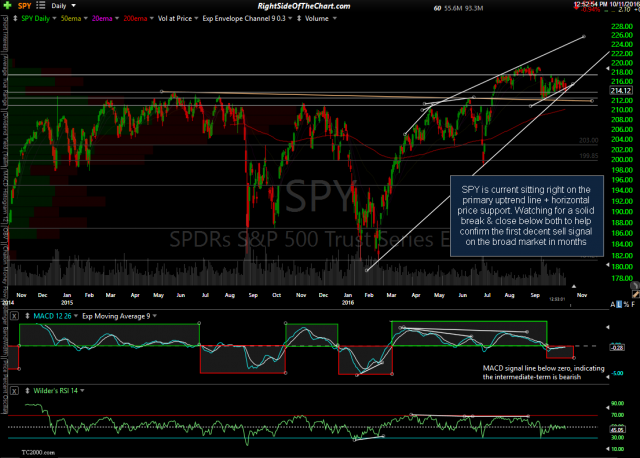
QQQ (Nasdaq 100 tracking etf) is currently trading slightly below this daily uptrend line along while SPY (S&P 500 tracking etf) is current sitting right on the primary uptrend line + horizontal price support. Watching for a solid break & close below both, along with follow through selling this week, to help confirm the first decent sell signal on the broad market in months.
- QQQ daily Oct 11th
- SPY daily Oct 11th
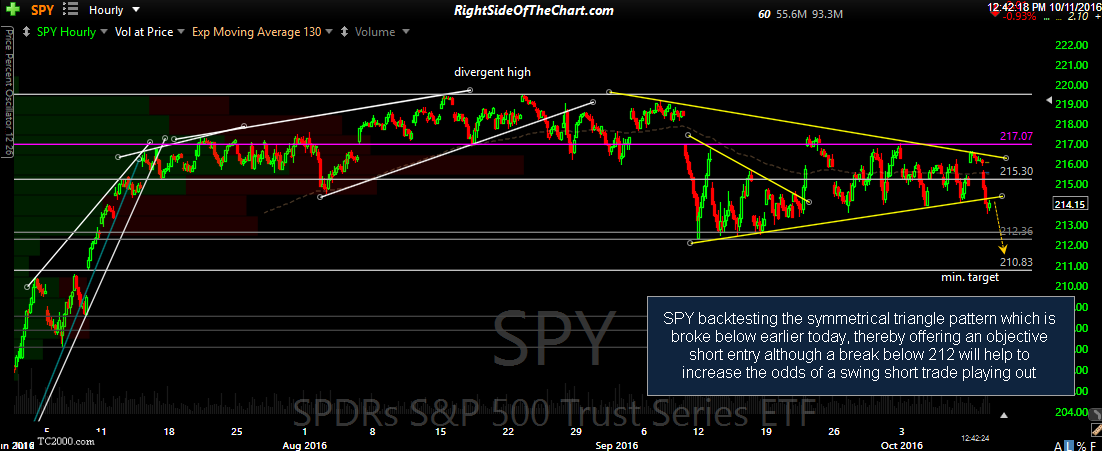
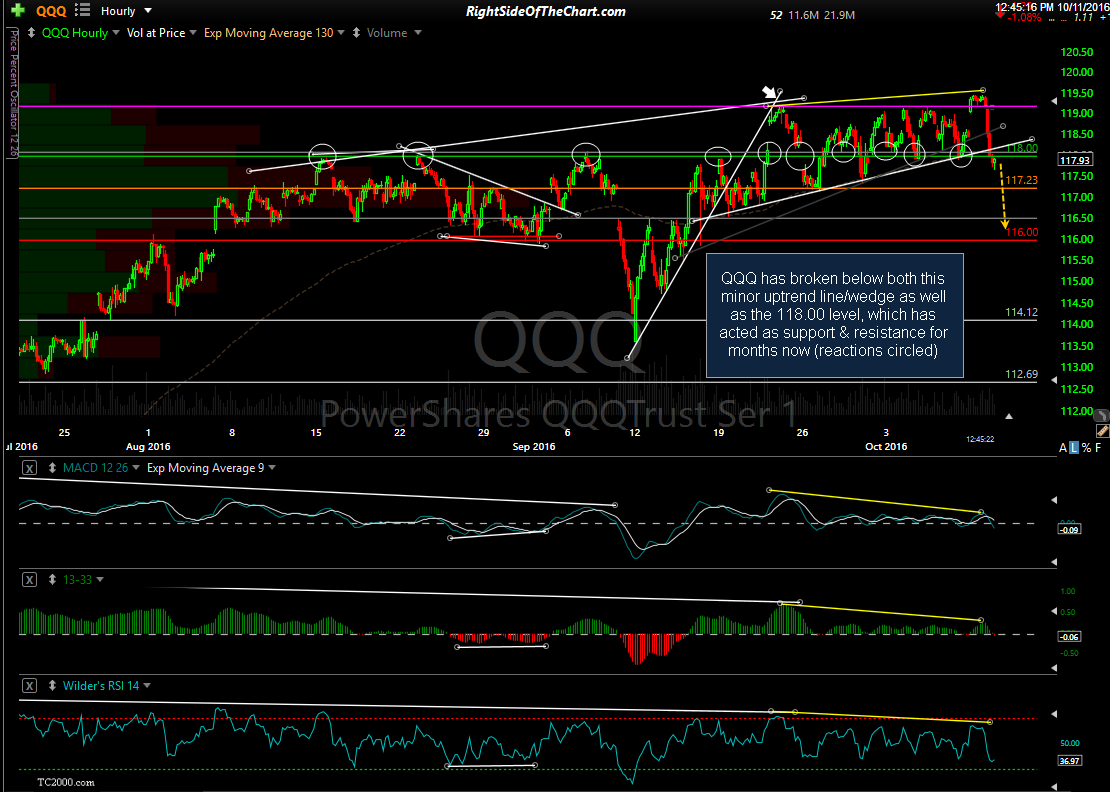
Zooming down to the 60-minute time frame can often give us some insight as to which tags of support on the daily time frame will prove to be a buying opportunity, producing a meaningful reversal, and which tags of support are likely to see prices break down below those levels, thereby providing objective short entries for a swing trade on the broad markets as well as any other bearish trade setups in individual stocks & sectors.
On the 60-minute time frames, QQQ has broken below both this minor uptrend line/wedge as well as the 118.00 level, which has acted as support & resistance for months now (reactions circled) while SPY backtesting the symmetrical triangle pattern which is broke below earlier today, thereby offering an objective short entry although a break below 212 will help to increase the odds of a swing short trade playing out.


