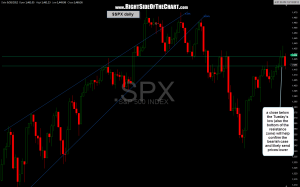
 All in all, a bearish day but I would have preferred to see the $SPX close below Tuesday’s low of 1418.55 (which is also just below the bottom of my $SPX resistance zone). Therefore, I will wait to see how we follow thru tomorrow and possibly even early next week.
One thing that I wanted to clarify regarding the previous post was the shooting star candlestick that I mentioned. Regarding chart and candlestick patterns when using technical analysis to forecast future price trends, these patterns can sometimes be subjective and mustn’t always strictly adhere to the criteria or definition of the pattern. Take yesterday’s shooting star in the $SPX and let’s revisit the definition from stockcharts.com that I previously posted:
The shooting star is made up of one candlestick (white or black) with a small body, long upper shadow and small or nonexistent lower shadow. The size of the upper shadow should be at least twice the length of the body and the high/low range should be relatively large. Large is a relative term and the high/low range should be large relative to the range over the last 10-20 days.
For a candlestick to be in star position, it must gap away from the previous candlestick. In Candlestick Charting Explained, Greg Morris indicates that a shooting star should gap up from the preceding candlestick. However, in Beyond Candlesticks, Steve Nison provides a shooting star example that forms below the previous close. There should be room to maneuver, especially when dealing with stocks and indices, which often open near the previous close. A gap up would definitely enhance the robustness of a shooting star, but the essence of the reversal should not be lost without the gap.
By Greg Morris’s definition above, we did not get a shooting star on the $SPX yesterday because the $SPX opened exactly at the same level that it closed at on Tuesday (1427.84). However, as Steve Nison, (who is widely considered the premiere authority on candlesticks) states above; “there should be room to maneuver, especially when dealing with stocks and indices, which often open near the previous close. A gap up would definitely enhance the robustness of a shooting star, but the essence of the reversal should not be lost without the gap.”
Like Nison, I believe it is the essence of the price action that is important and as such, felt that it was worthwhile to discuss these potential reversal candlesticks that have been put in over the last couple of days. FWIW, the SPY ($SPX tracking etf), did in fact gap up yesterday while the $SPX opened flat (the SPY opened at 144.00 yesterday vs. a close of 143.44 on Tuesday) which helps add to the validity of an $SPX “star” position candlestick yesterday. Most importantly is that going forward we need to see prices continue to move lower. Any move above yesterday’s highs would essentially negate the bearish implications of yesterday’s shooting star. The updated daily chart above reflects how the $SPX just managed to pull back up into the key resistance zone by the close. I believe any solid move and close below this level will most likely open the door to additional downside in the markets.

