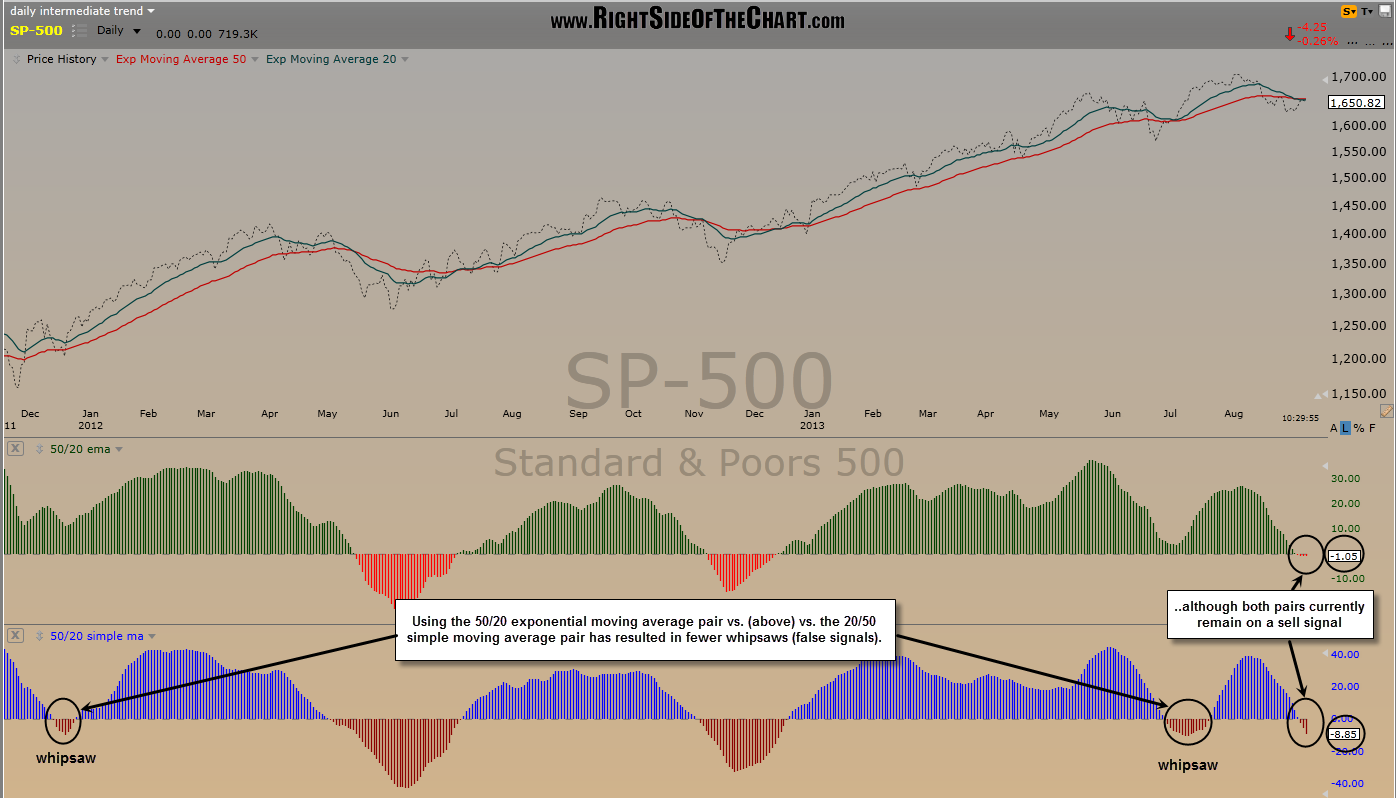
Some traders & technicians prefer using simple moving averages over exponential moving averages. Although I typically prefer exponential averages, I am not married to the use of either (or any of the other variations used in the calculation of moving averages). However, as I’ve recently discussed the bearish 20/50 ema cross, which is used to help define the intermediate-term trend, this chart helps illustrate why my preference has been to use the exponential setting on the popular 50/20 moving average pair vs. a simple MA setting. As this daily chart of the $SPX shows, the exponential pair has done a better job of avoiding whipsaws (false buy or sell signals) than the simple moving average pair. In the example above, I’ve highlighted the crossovers using a histogram, as it makes for a more clear visual than trying to discern when the moving average lines have actually crossed over. Any histogram reading below zero means that the faster average (20 day) is trading below the slower average (50 day). Bearish crossover are also identified via the red colored histogram bars which represent negative values. Note: The pair of red and green lines overlaying price on the chart above are the 50 & 20 EMAs.

