
The /ZB (30-yr Treasury bond futures) swing trade is starting to crack below this 60-minute bearish rising wedge pattern with a tradable pullback likely if it sticks (via a solid 60-minute candlestick close below the wedge). Previous (Oct 19th trade setup & Nov 3rd “T3 hit, pullback likely”) and updated 60-minute charts below.

ZB 60m Oct 19th
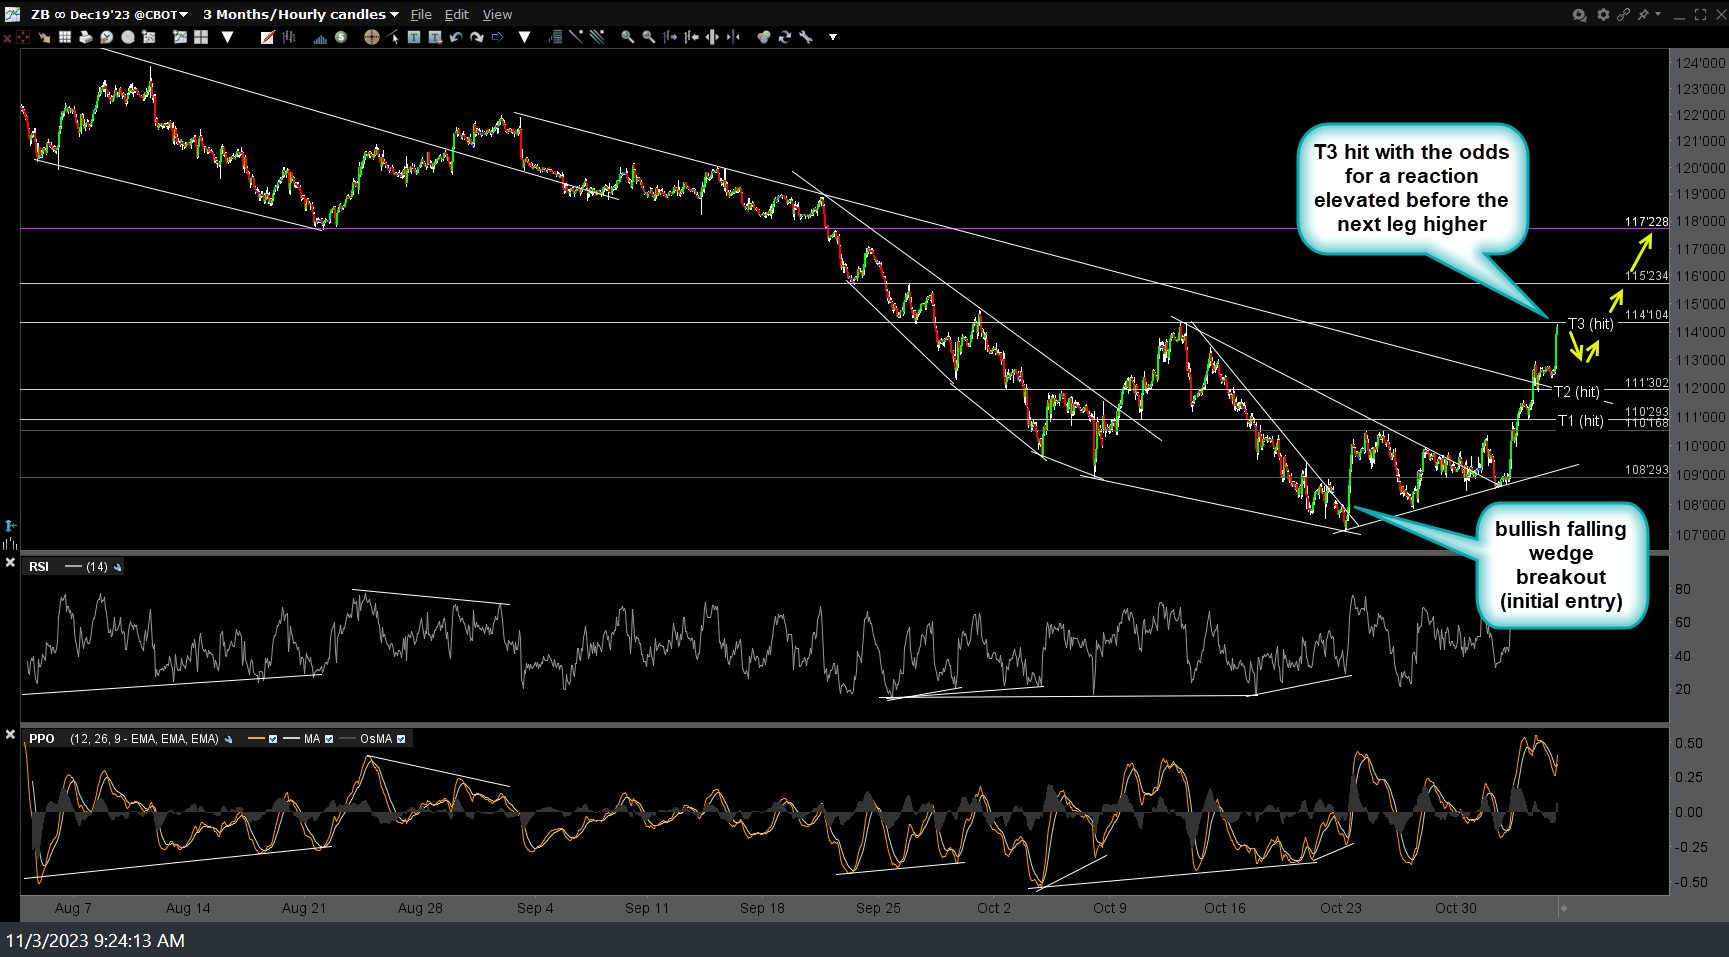
ZB 60m Nov 3rd
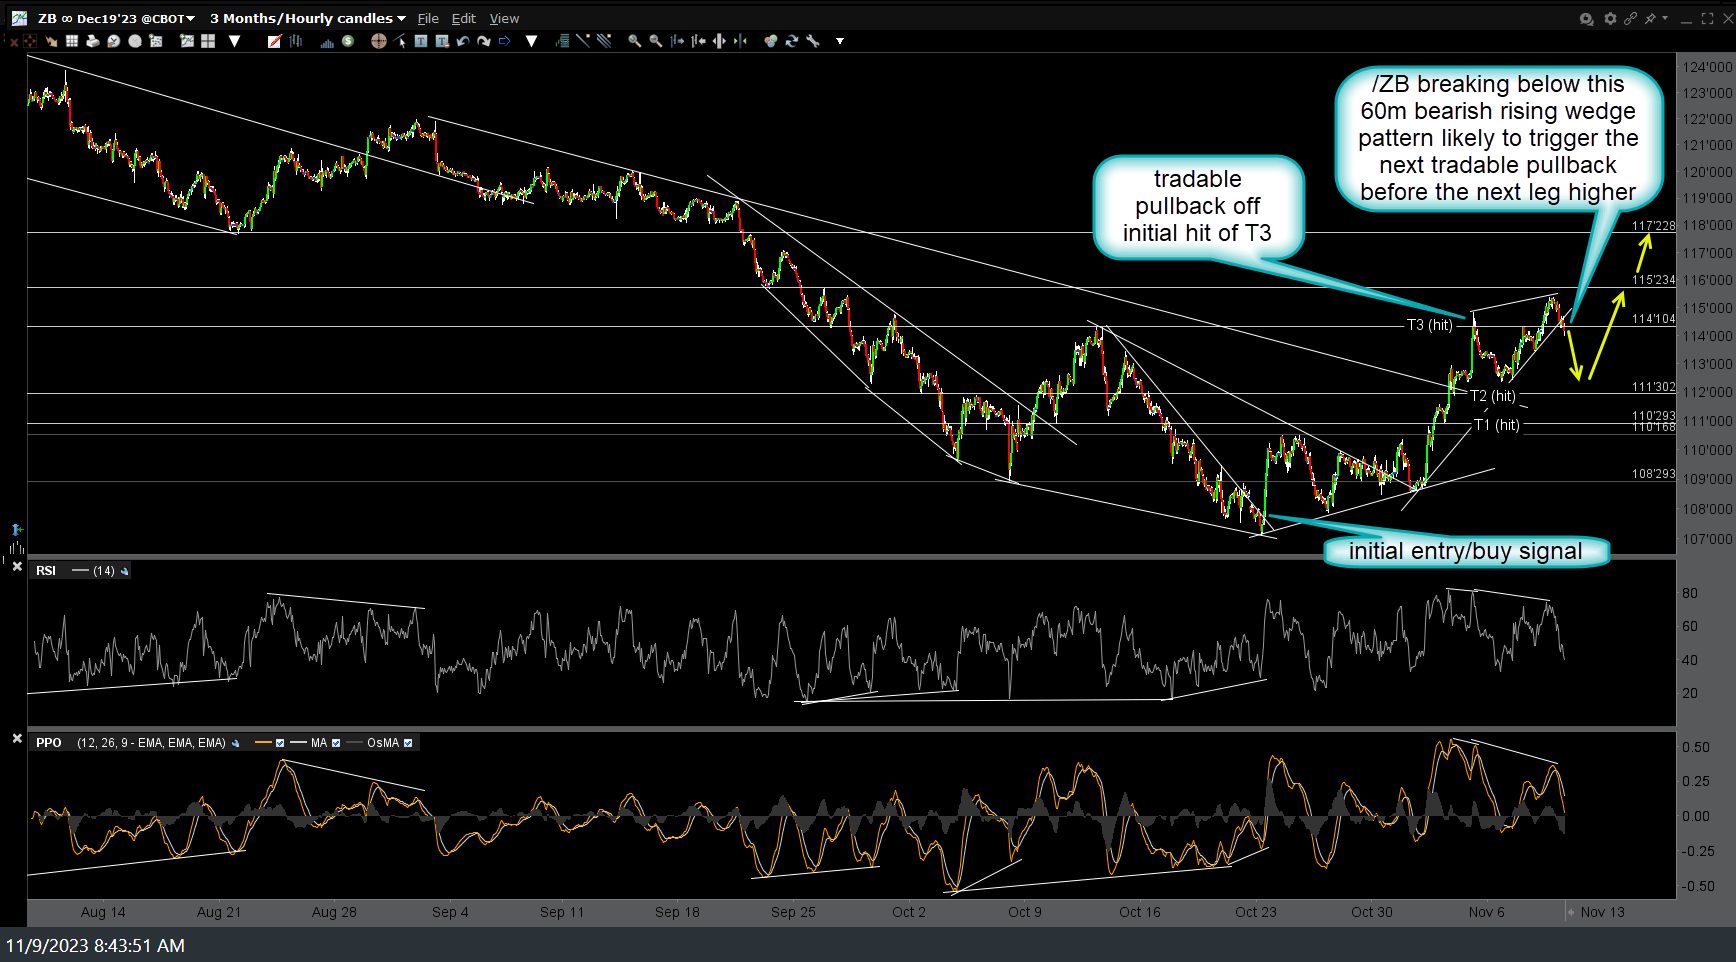
ZB 60m Nov 9th
TLT 60-minute chart for reference (and those trading the ETF vs futures) below. Also, note that should Treasury bonds correct (i.e.- yields rally), that would most likely trigger a concurrent pullback in the stock market.
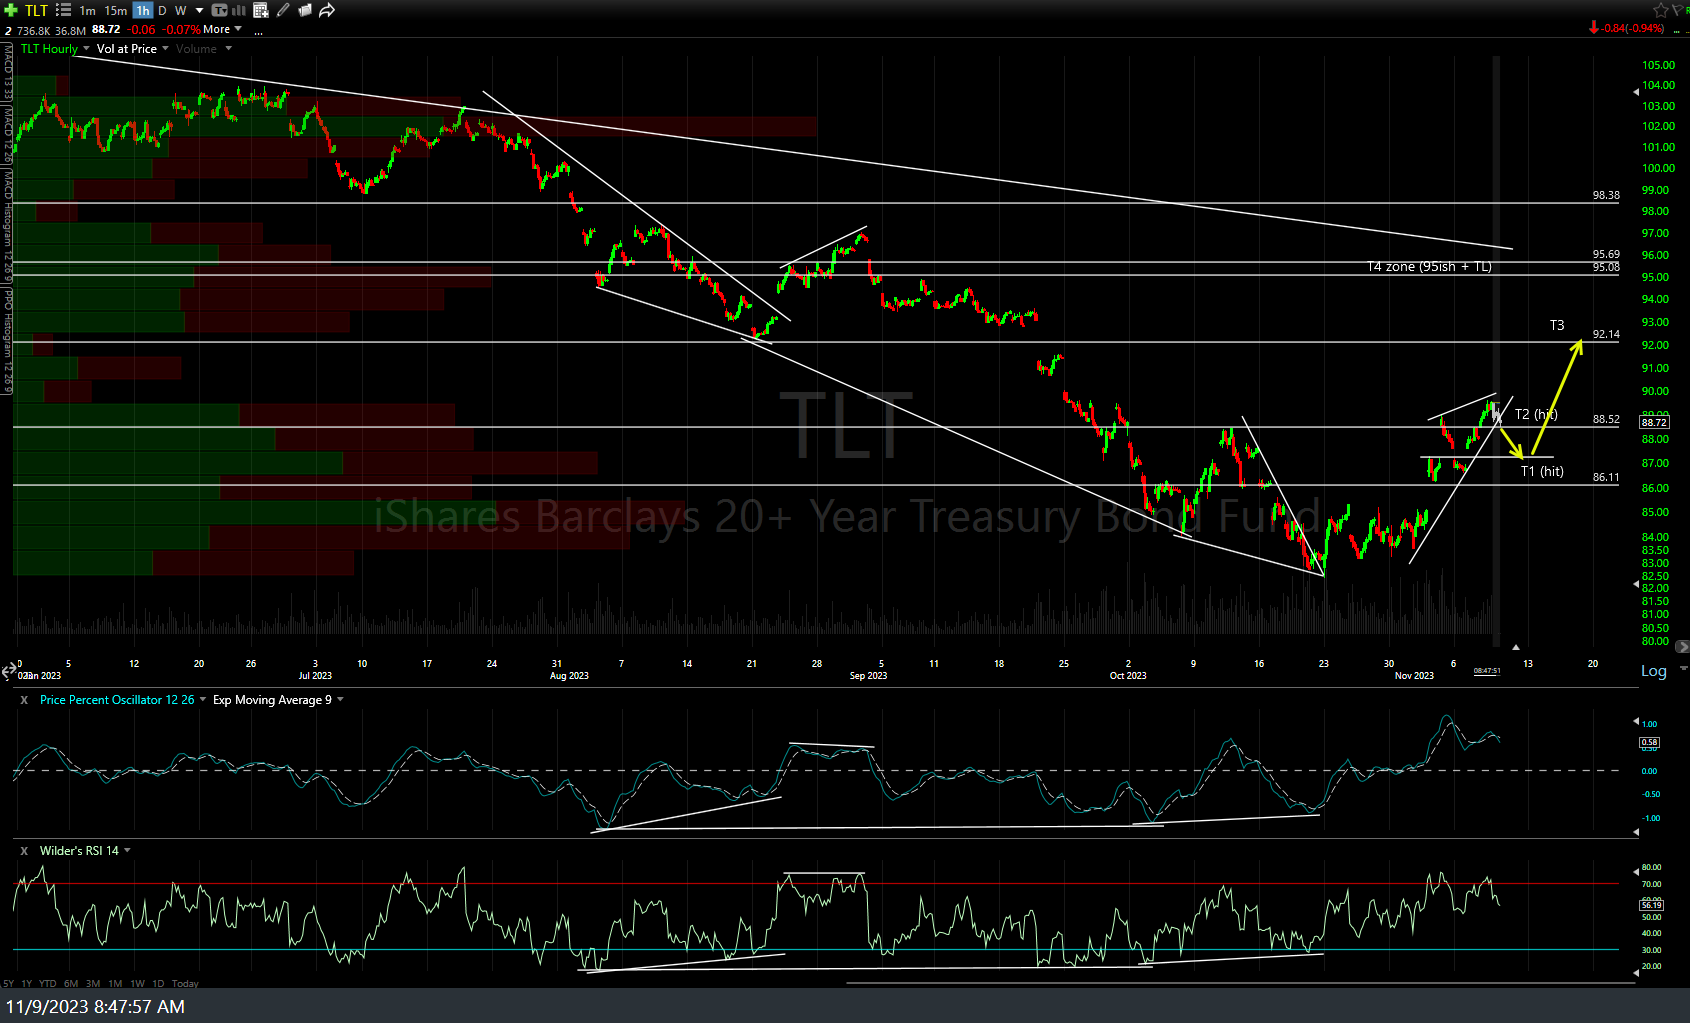
TLT 60m Nov 9th