
Reason #1
F (Ford Motor Co.) is backtesting this weekly downtrend line, which is likely to act as support.
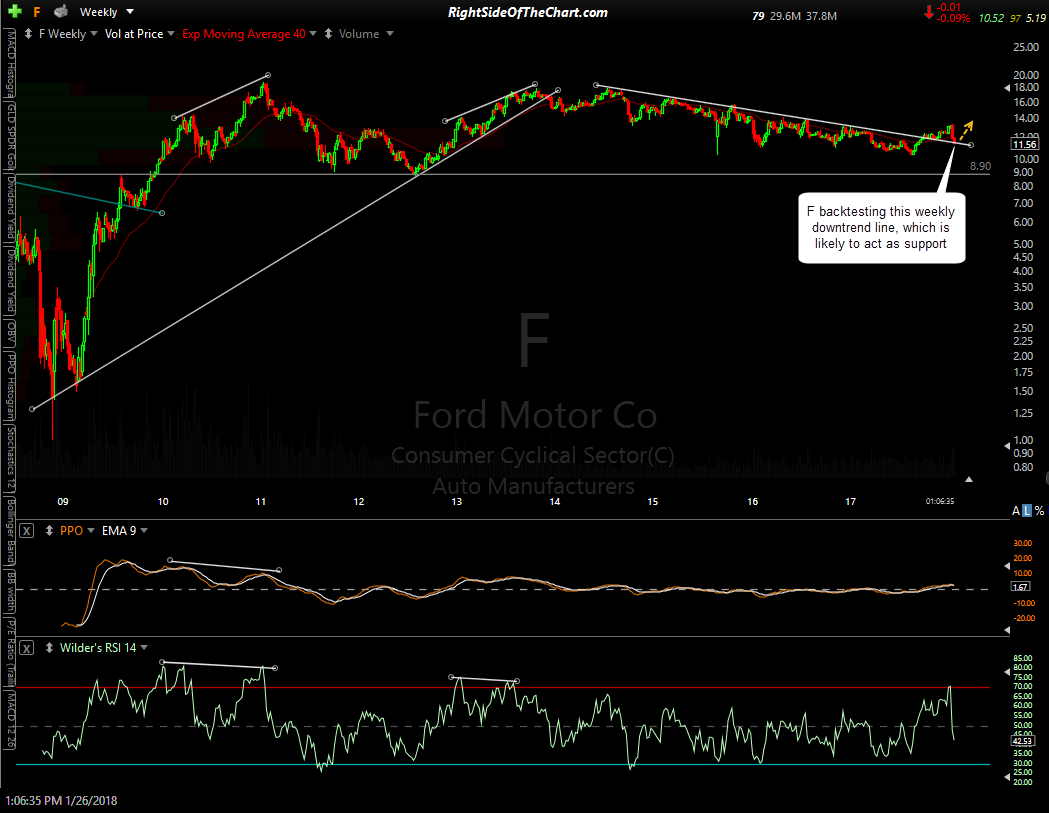
F weekly Jan 26th
Reason #2:
Ford has fallen to support on the daily time frame while oversold for the first time since the Aug ’17 divergent low, just before it rallied 29% to the recent divergent high.
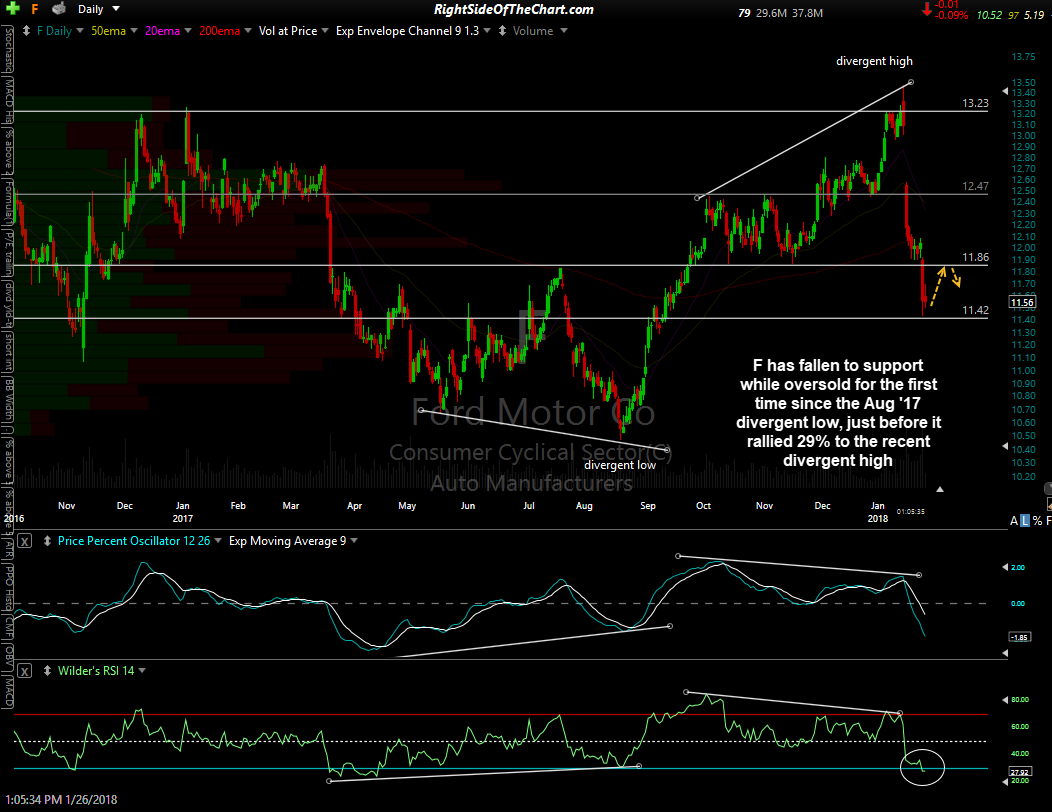
F daily Jan 26th
Reason #3
Ford has bullish divergences on the 60-minute time frame as it hits support on both the daily & weekly time frames. Minimum bounce target 11.88 (unadjusted target, actual resistance level.. best to set your sell limit order a few cent below the actual sport level).
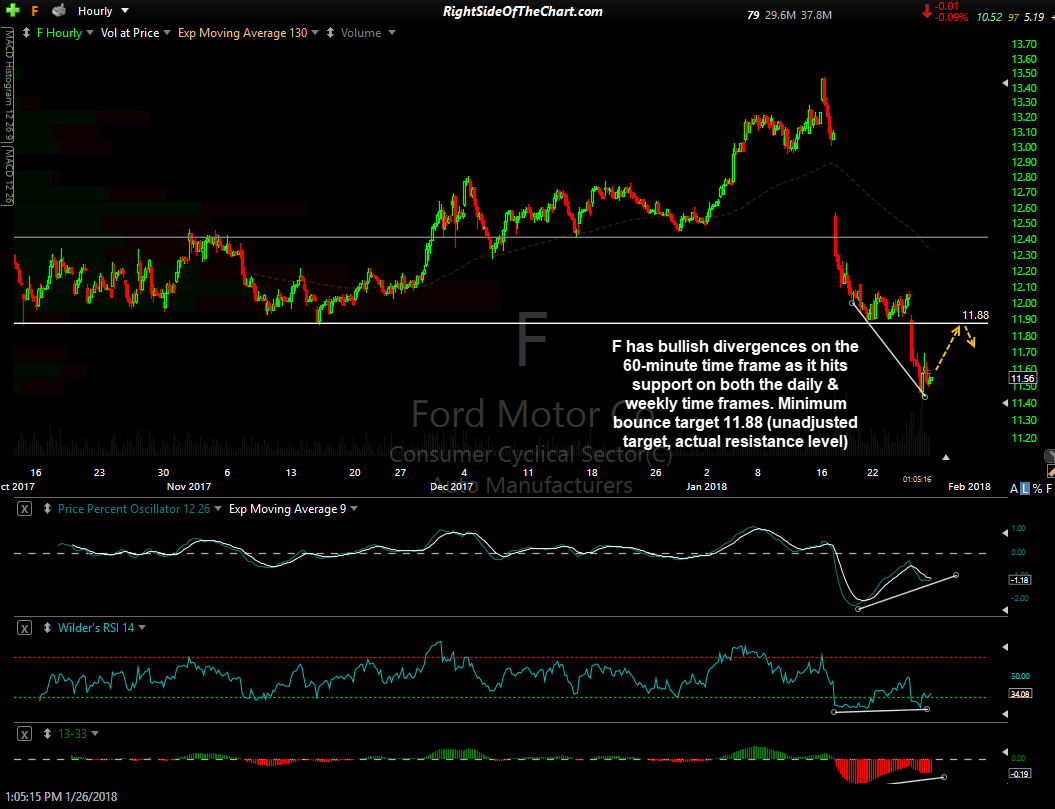
F 60-min Jan 26th
Bottom line: Based on the fact that F recently broke above that long-term downtrend line the week chart & is currently backtesting it from above following the recent sharp selloff, the case could be make for a long-term swing or trend trade in Ford at this time. My personal plan is only to game a quick “oversold, off support” bounce to the 11.85 level with a relatively tight stop below yesterday’s lows.
From my analysis of the charts, I currently favor a relatively minor (~3.7%) rally off yesterday’s lows, followed by at least one more thrust down in Ford although I plan to stand aside & watch the stock after this trade either hits my price target or is stopped out. I also see limited upside in the major automakers as per the recent Automakers Setting Up for a Swing Trade post from January 18th. With that being said, those longer-term bullish on the broad market as well as the auto makers, or at least Ford, might opt to take a partial or full position here with a more liberal stop (based on your current price target), adding to a partial position as & if the charts begin to firm up.