
One of the sectors that I’m closing monitoring for a potentially lucrative swing shorting opp are the major automakers. U.S auto manufacturers collectively reported lower U.S. sales in December, with total sales for 2017 falling shy of the record set in 2016 and representing the first annual decline since the financial crisis eight years ago.
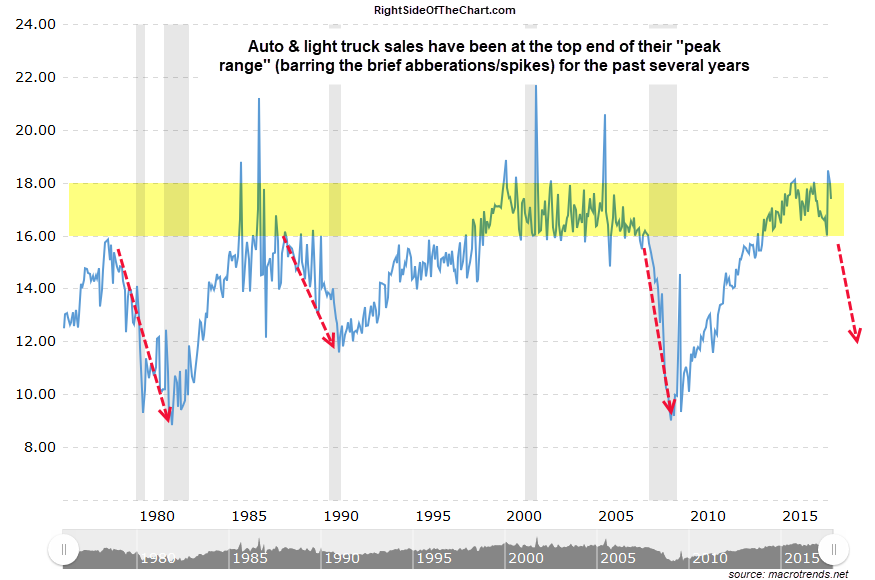
Auto Sales Jan 18th
With sales of autos & light trucks hovering at the high-end of the historic range for the last several years & reliability of new cars continuing to improve, it is hard to argue that there is or will soon be a glut of new & ‘like new’ cars on the road. As with all cycles of auto sales, this will hurt the demand for new cars & trucks, also spilling over to the used car market. Just how much auto sales will drop off during the next downturn in the industry will largely depend on how well the economy is doing, specifically consumer confidence, employment & wage growth (or lack thereof).
Whether or not, or more accurately, when that fundamental case for a downturn in auto sales manifests in the form of a trend reversal will only be known with certainty in hindsight. However, using technical analysis we can more accurately identify when to short the automakers, which automakers to short & when to cover those short positions. There’s still some work to be done in order to firm up the case for a swing short trade on the automakers & that could come anywhere from days, weeks or even months from now. As long as the broad market remains in melt-up mode, we need to be extra selective with short trades & while these are not official trade ideas yet, I did want to share these potential setups for those interested.
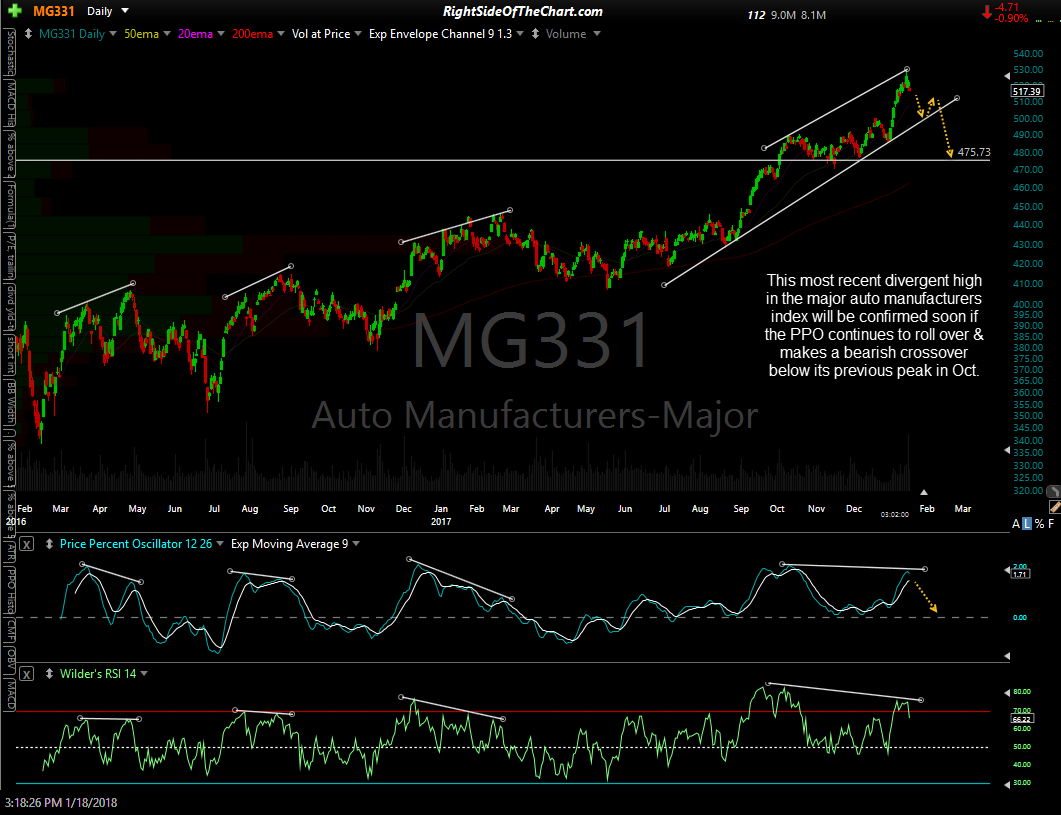
Major Auto Manufacturers Index Jan 18th
The first chart above is the Major Auto Manufacturer’s index.This most recent divergent high in the index will be confirmed soon if the PPO continues to roll over & makes a bearish crossover below its previous peak in October. Should that occur soon, my minimum expectation would be for a drop of 10% from Tuesday’s high.
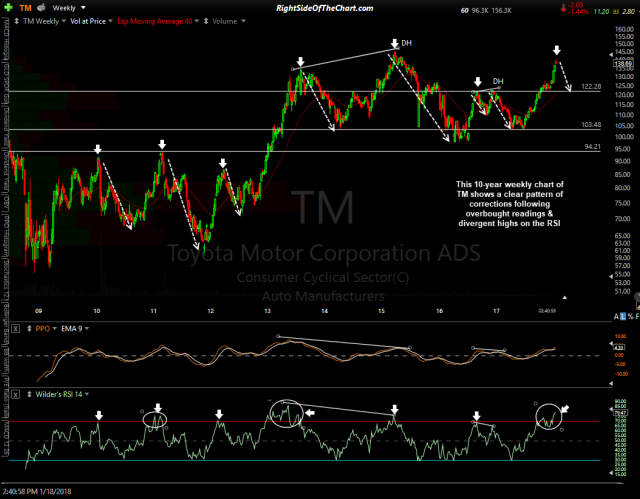
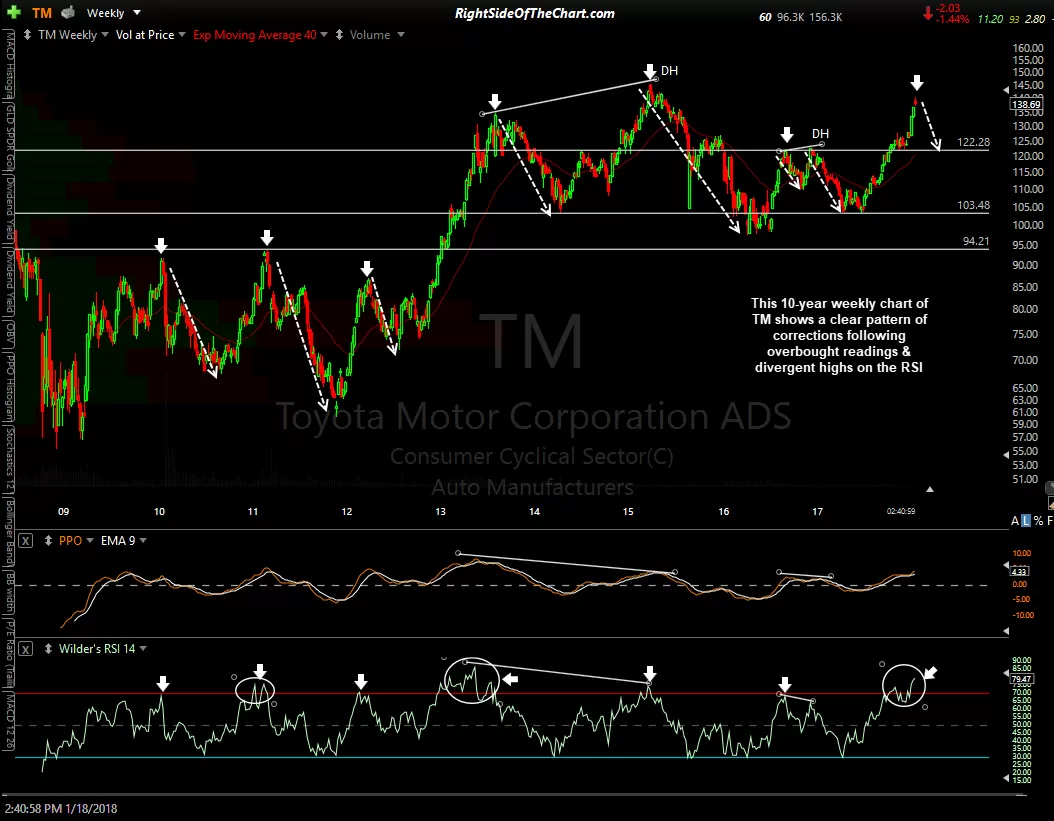
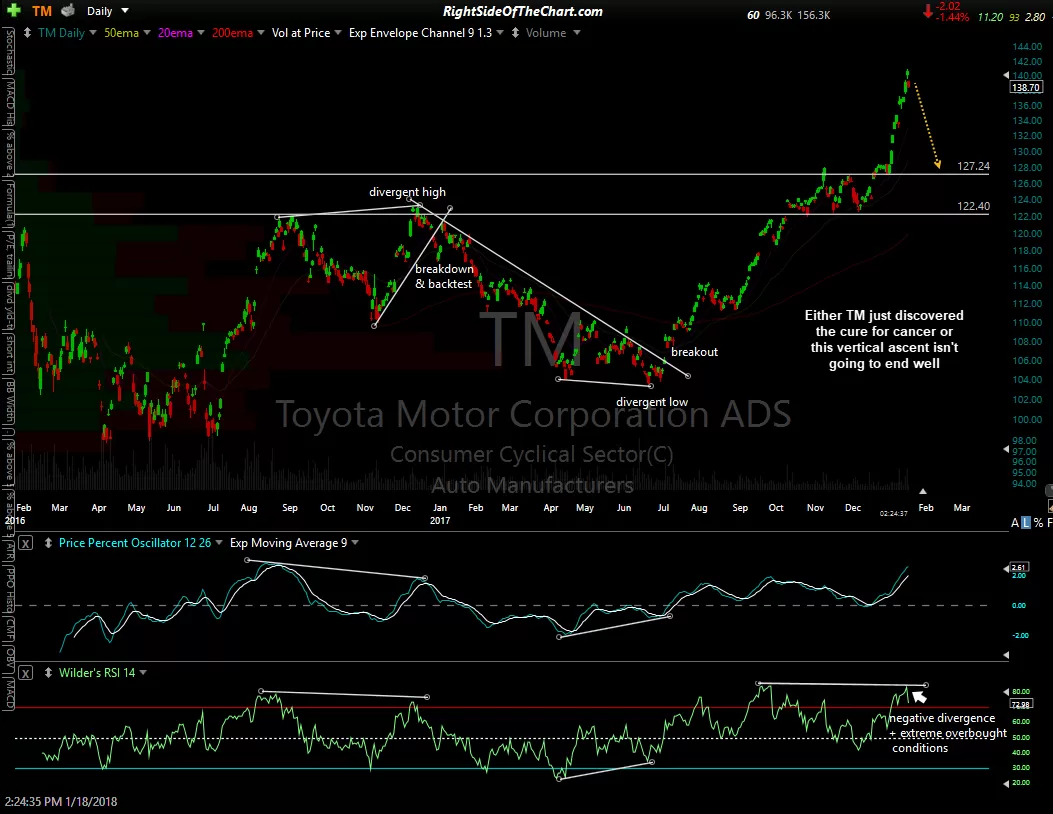
Looking at the individual automakers, this 10-year weekly chart of TM (Toyota Motor Corp) below shows a clear pattern of corrections following overbought readings (arrows) & divergent highs on the RSI. The circles show the extreme overbought readings, with the current overbought conditions on second to those back in 2013 which was followed by a 23% correction in the stock. The daily chart of Toyota below shows the current unsustainable, near-vertical advance.
-
- TM weekly Jan 18th
-
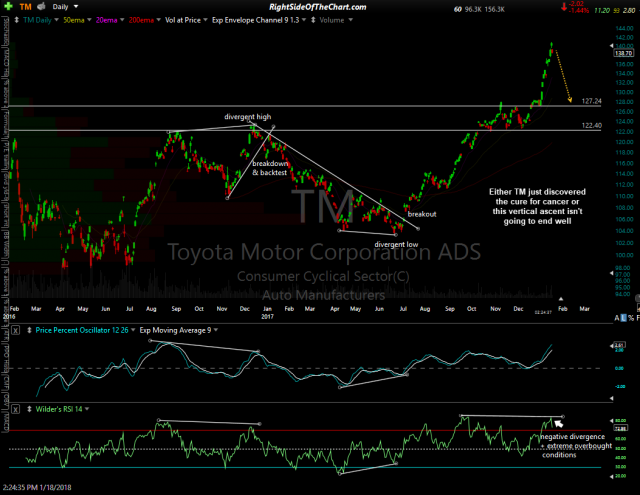
- TM daily Jan 18th
Next up is F (Ford Motor Co.) which is the first of the major automakers to succumb to its technicals. Ford rallied up to the 13.23 resistance level with negative divergence in place on Tuesday of this week, plunging nearly 11% so far since that failed attempt to at resistance. At this time, I only see about another 1½% downside (excluding the possible brief momentum-fueled overshoot) before a meaningful reaction off the 11.86 support level. One down, four to go.
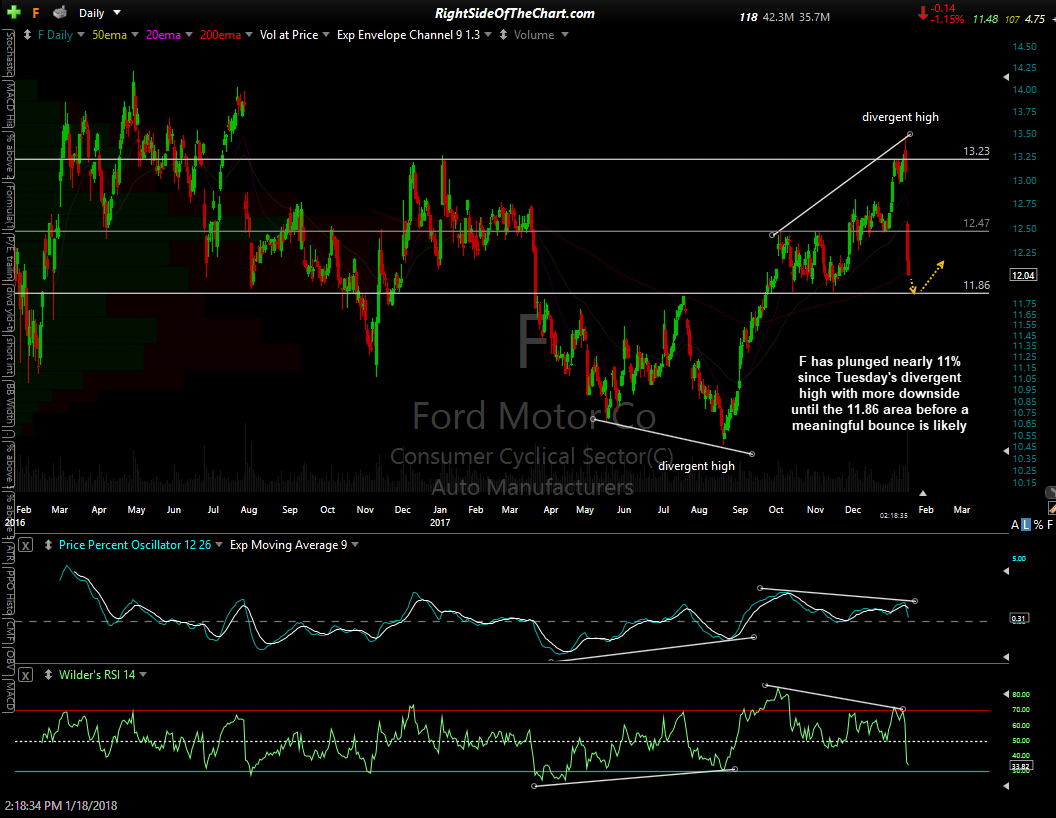
F daily Jan 18th
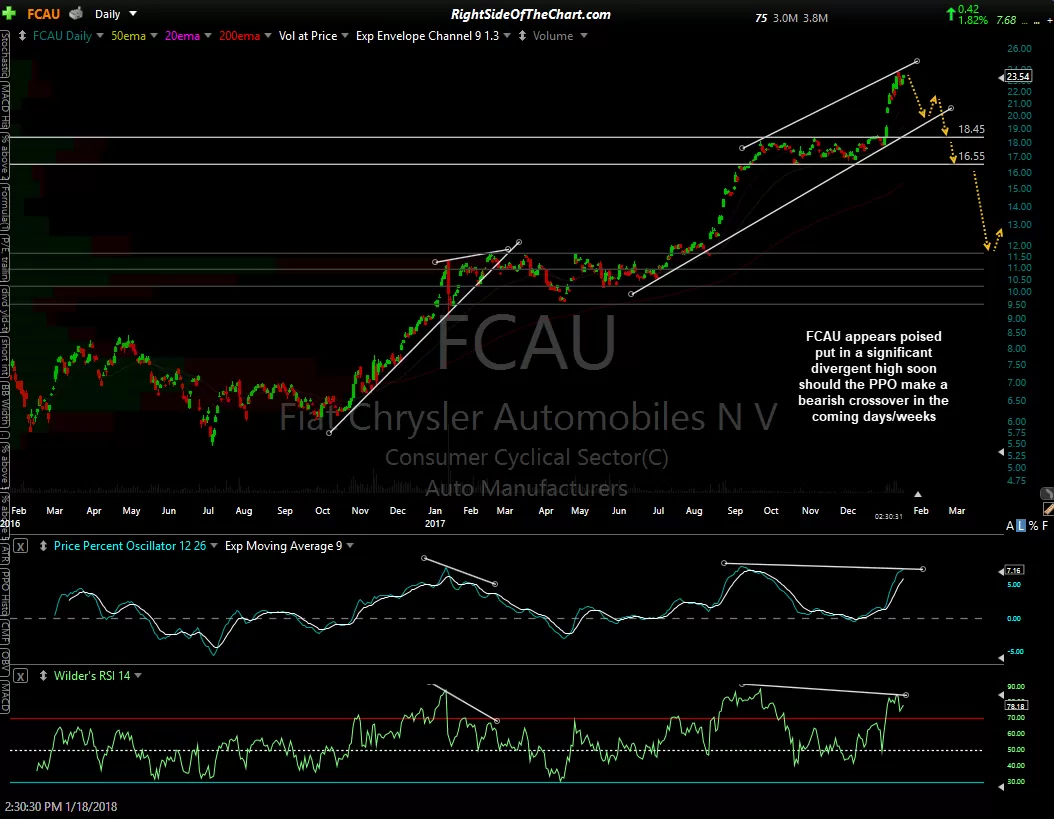
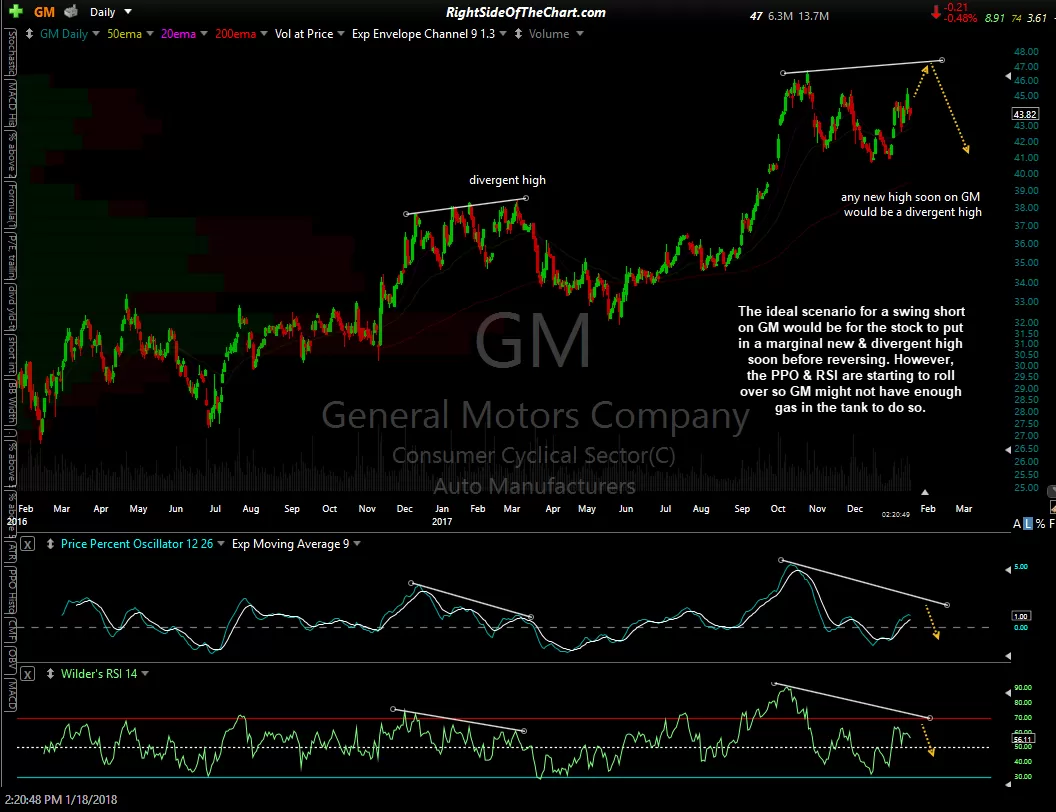
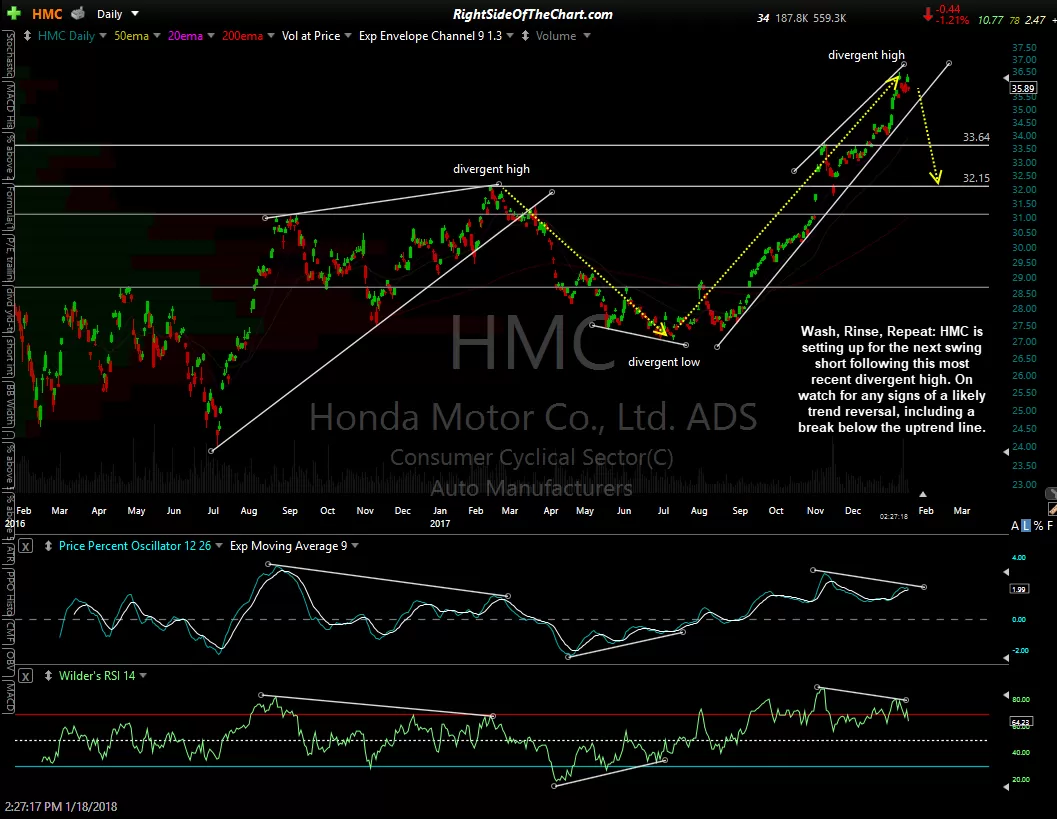
The rest of these charts are pretty clear & all tell the same story: Overbought with negative divergences building on the momentum indicators on these daily charts of FCAU (Fiat Chrysler), GM (General Motors) & HMC (Honda Motor Co.).
-
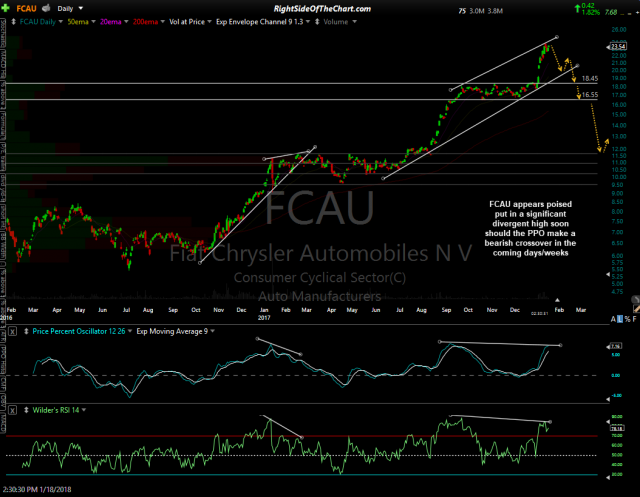
- FCAU daily Jan 18th
-
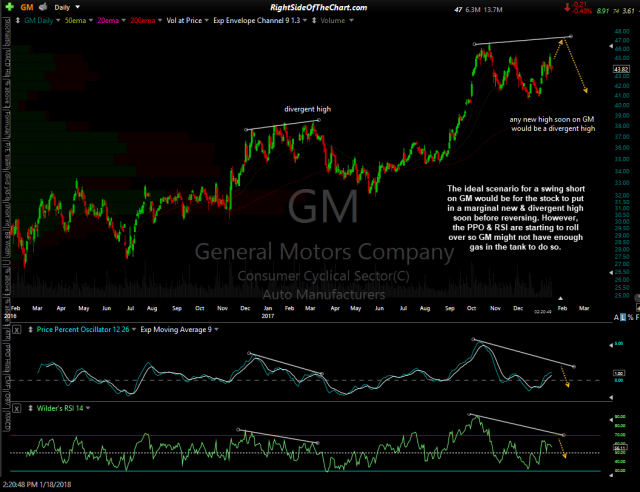
- GM daily Jan 18th
-
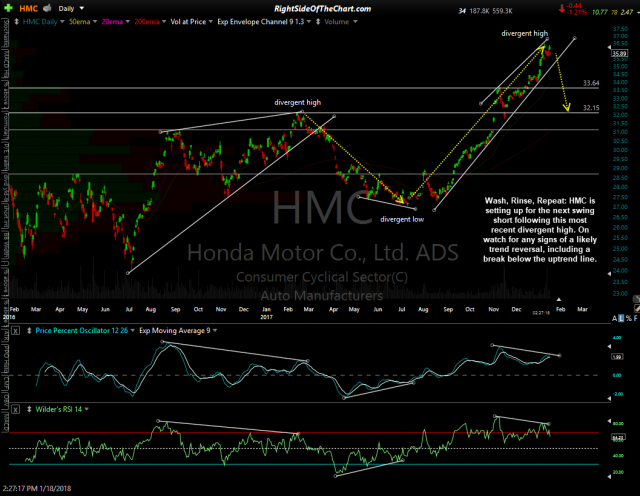
- HMC daily Jan 18th
Note: For those planning to take a short position in any of these stocks soon, be aware that they are scheduled to report earnings soon on the following dates/times:
F: Wednesday Jan 24th AMC (after market close)
FCAU: Thursday Jan 25th BMO (before market open)
HMC: Friday Feb 2nd BMO
TM: Monday Feb 5th (?)
GM: Tuesday Feb 6th BMO