
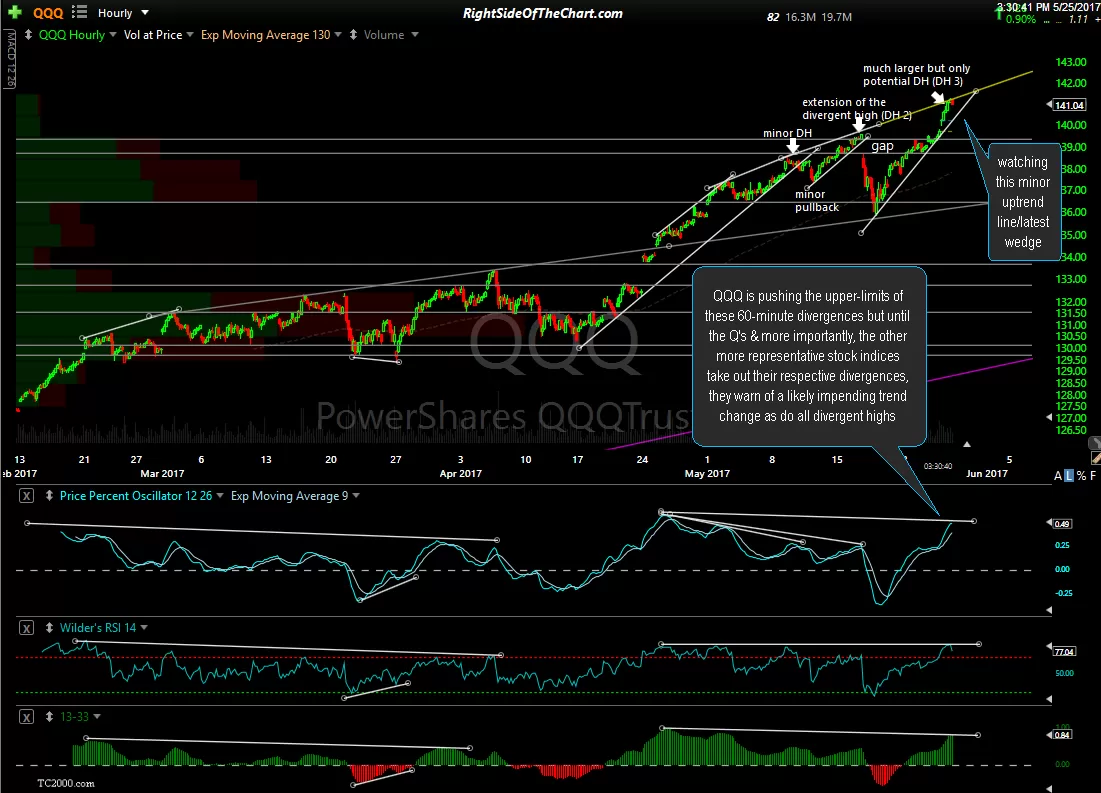
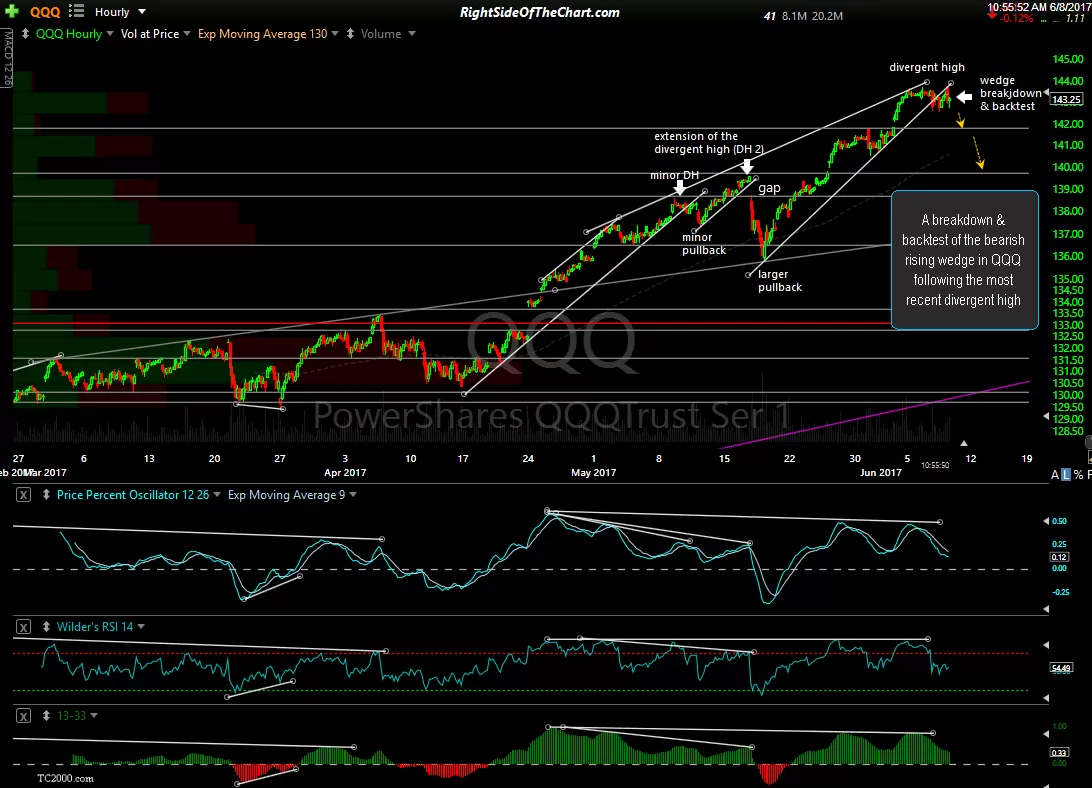
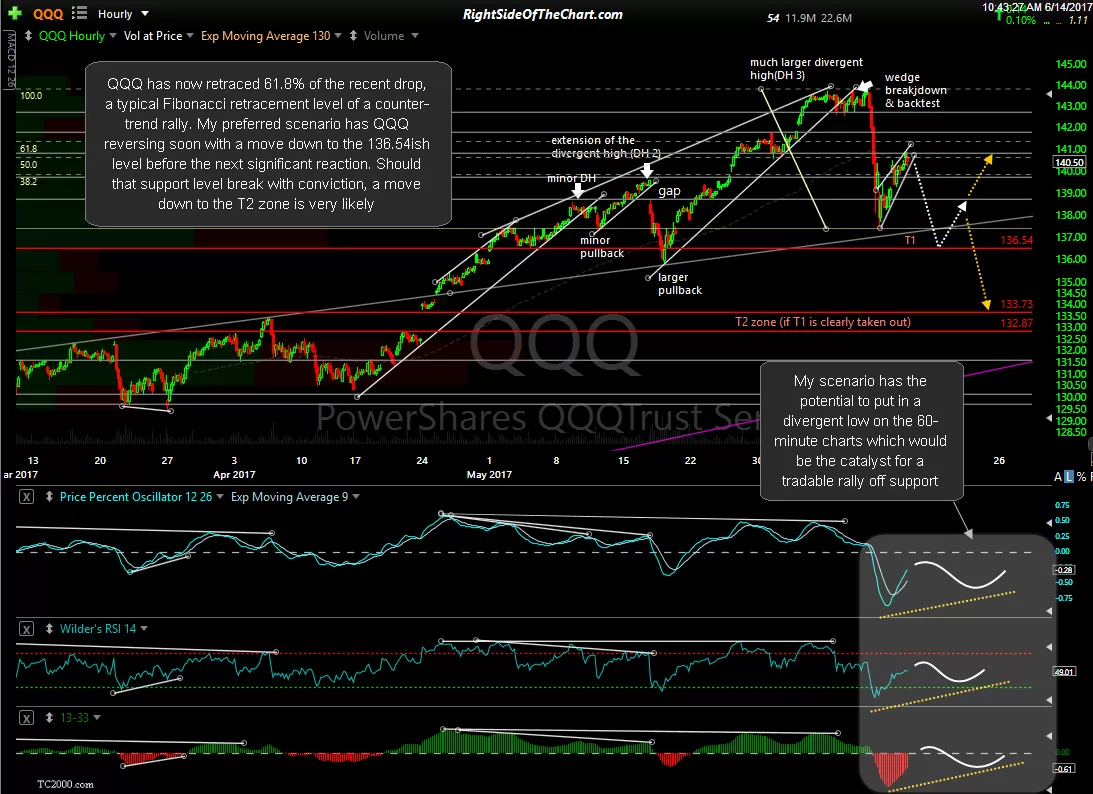
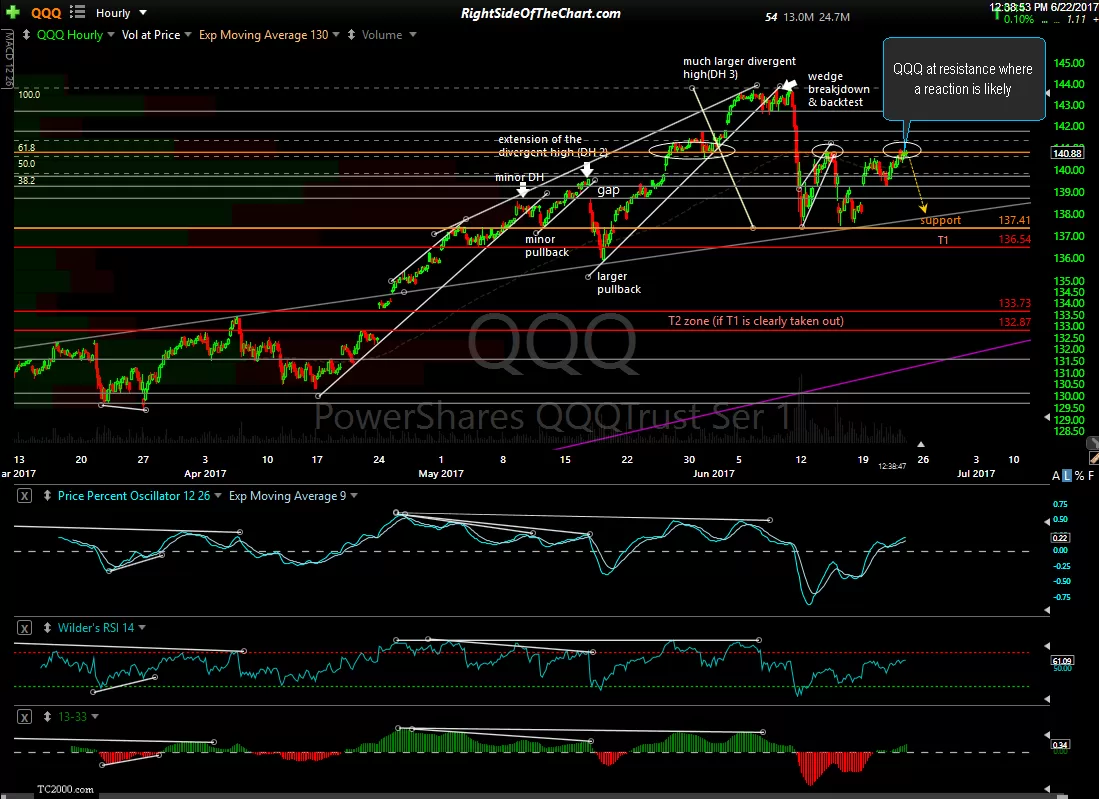
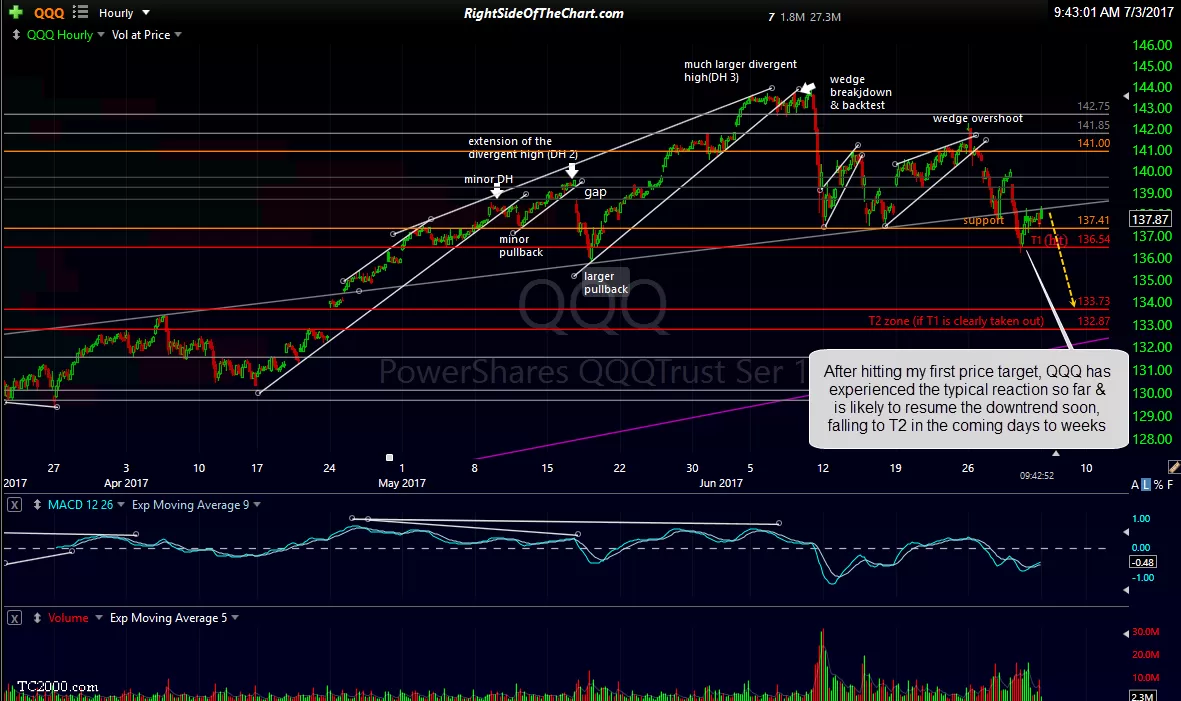
The following 60-minute charts on QQQ (Nasdaq 100 Tracking ETF) highlight three different perspectives; 2 bearish & 1 bullish. This first series of 60-minute charts goes back to May, just before QQQ peaked & started the current downtrend with a bang following the trendline break, along with concurrent breakdowns in all of the market leading FAAMG stocks on June 9th. After hitting my first price target, QQQ has experienced the typical reaction so far & is likely to resume the downtrend soon, falling to T2 in the coming days to weeks. Click on the first chart to expand, then click on the anywhere on the right of each expanded chart to advance to the next chart:
-
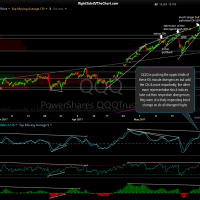
- QQQ 60-min May 25th
-
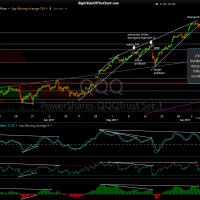
- QQQ 60-minute June 8th
-
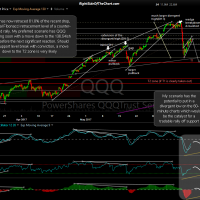
- QQQ 60-minute June 14th
-

- QQQ 60-minute June 22nd
-
- QQQ 60-minute 2 July 3rd
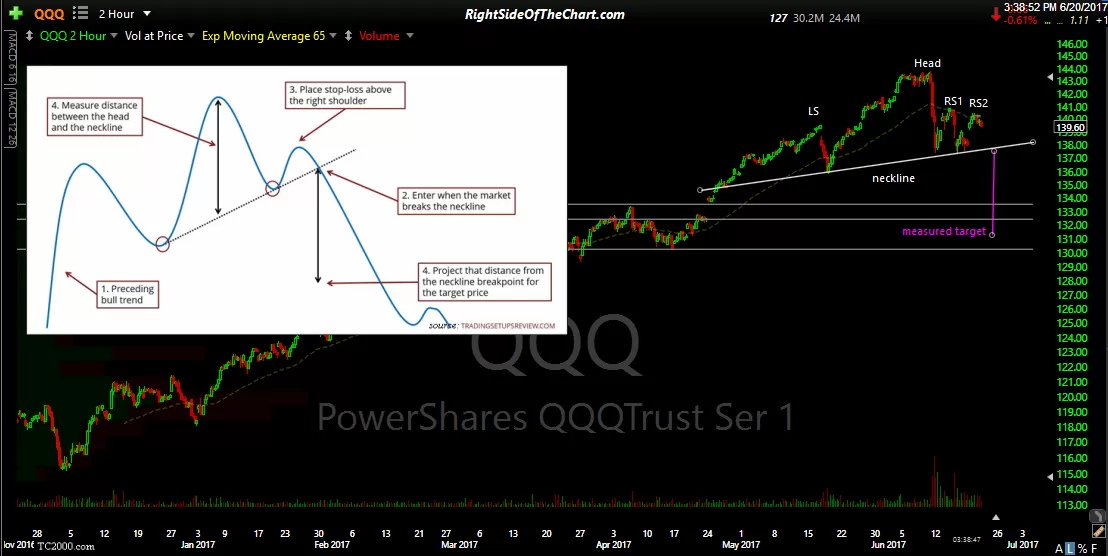
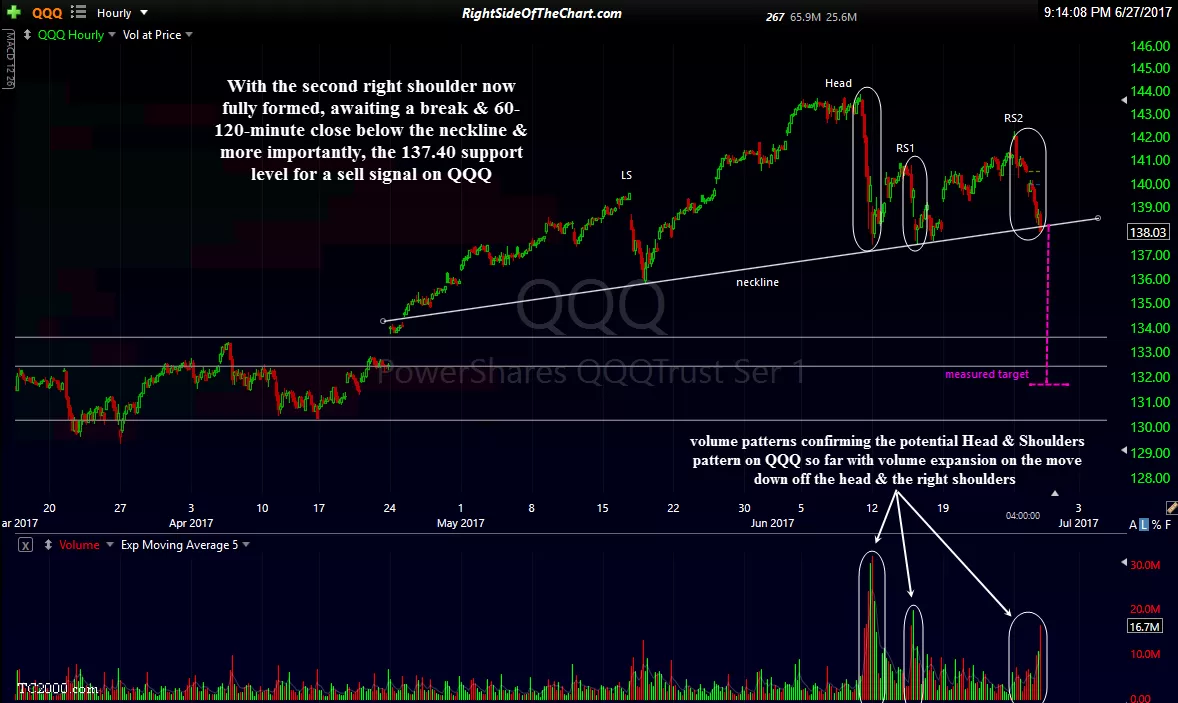
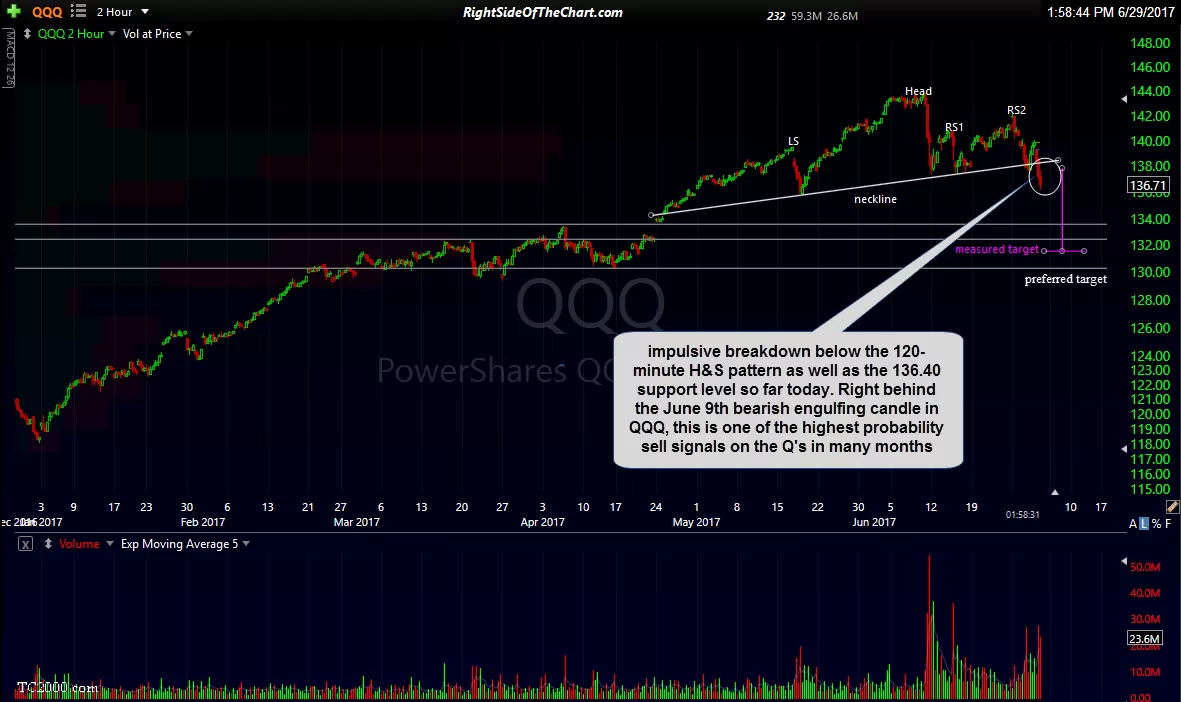
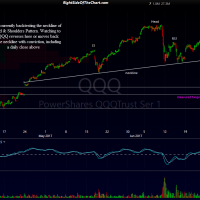
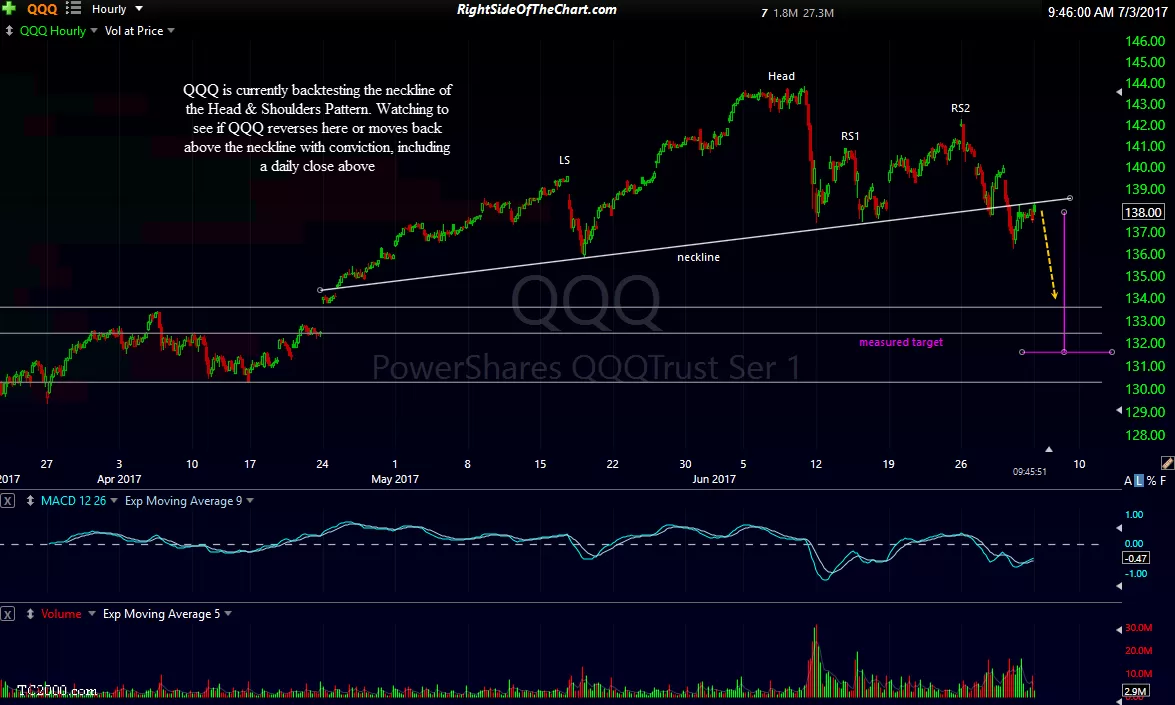
This next series of charts shows the Head & Shoulders pattern that I’ve recently been tracking on the 60 & 120-minute time frames. QQQ is currently backtesting the neckline of the Head & Shoulders Pattern. Watching to see if QQQ reverses here or moves back above the neckline with conviction, including a daily close above:
-
- QQQ 120-minute June 20th
-
- QQQ 120-minute June 27th
-
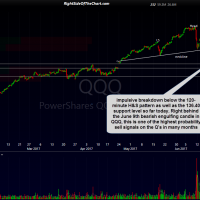
- QQQ 120-minute June 29th
-
- QQQ 60-minute 1 July 3rd
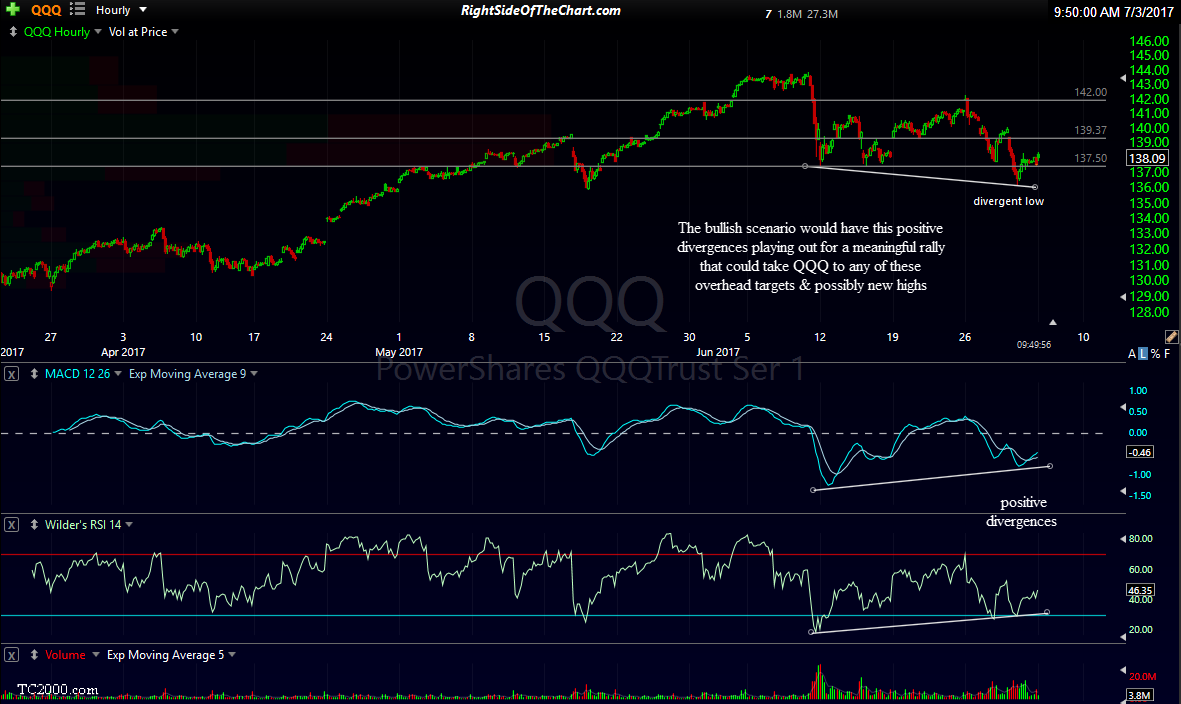
This third view highlights a potentially bullish scenario that would have these positive divergences playing out for a meaningful rally that could take QQQ to any of these overhead targets & possibly new highs:
QQQ 60-minute 3 July 3rd
I’m not a big fan of contradictory analysis but I would be remiss not to point out the bullish divergences that are in place on the 60-minute time frame & the potential for a meaningful rally, should they play out. However, if QQQ fails to mount any decent rally (3%+) and resumes the downtrend with these divergences being negated by the MACD & RSI both making lower lows (vs. their previous reaction lows on June 12th) that would be quite bearish just as bearish technicals that fail to play out as expected are typically followed by impulsive rallies. At this time, I continue to favor the bearish scenario with a move down to at least my 2nd price target zone.