While far from an all-inclusive list, the three charts below are some of the key charts that I’m watching today as the have the potential to determine where the market goes from here.
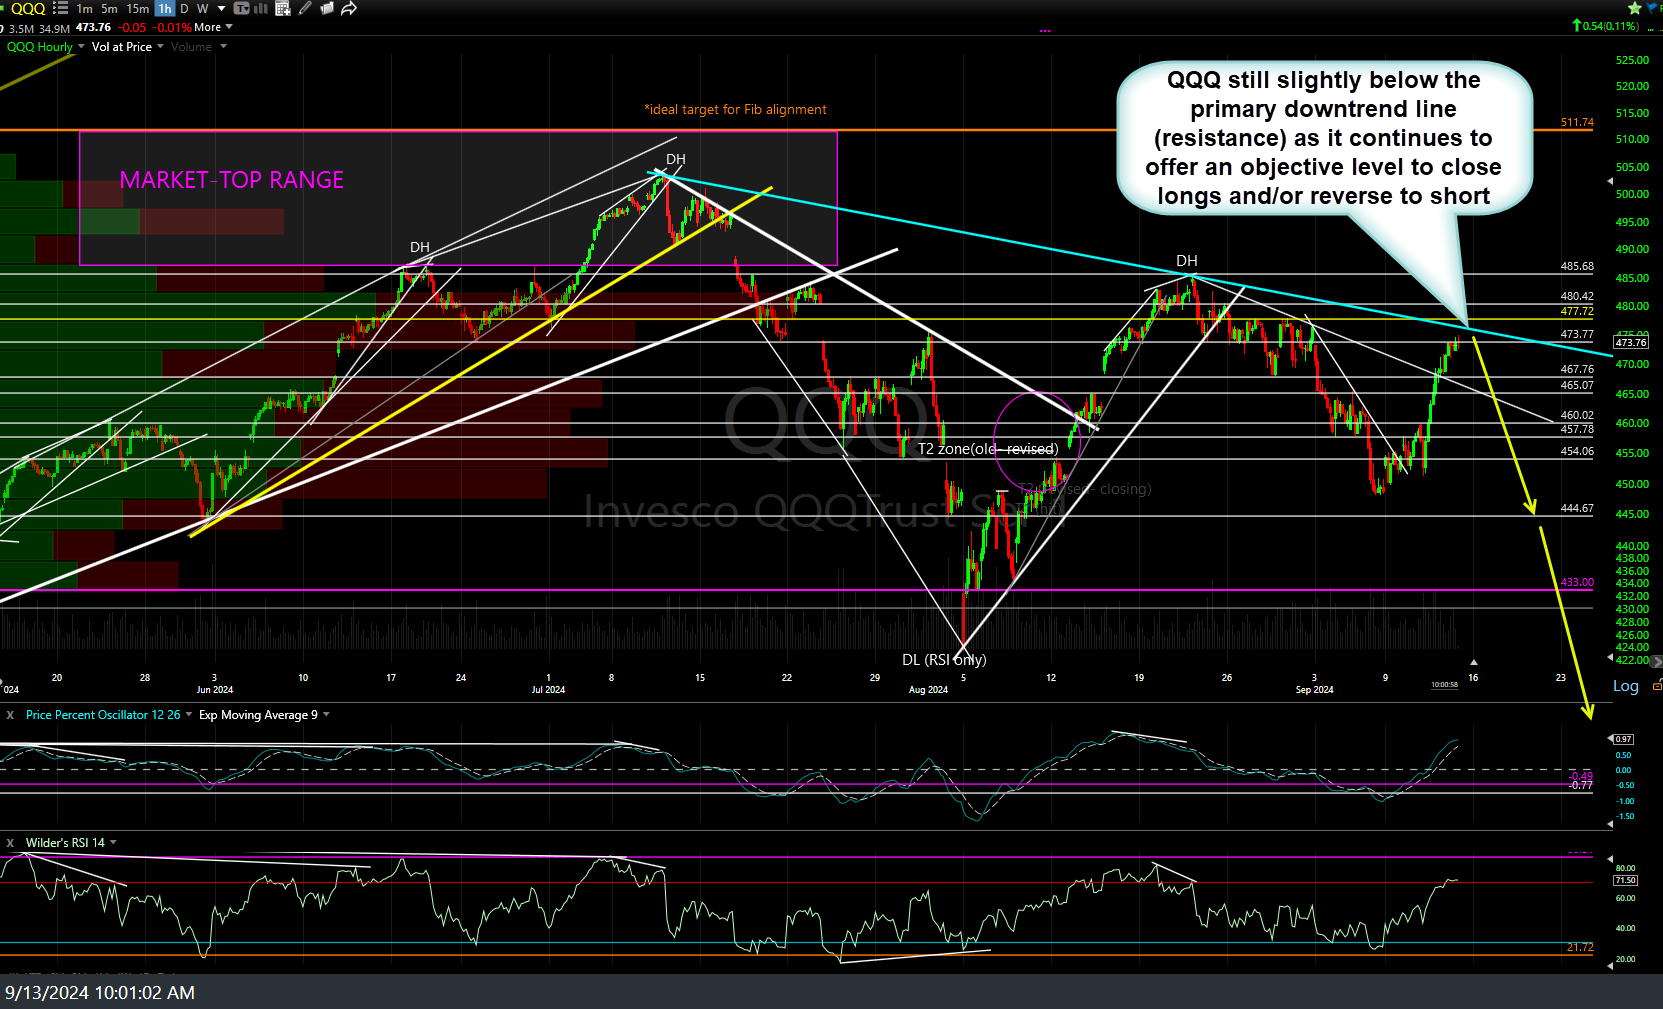
QQQ remains slightly below the primary downtrend line (key resistance) as it continues to offer an objective level to close longs and/or reverse to short. 60-minute chart below.
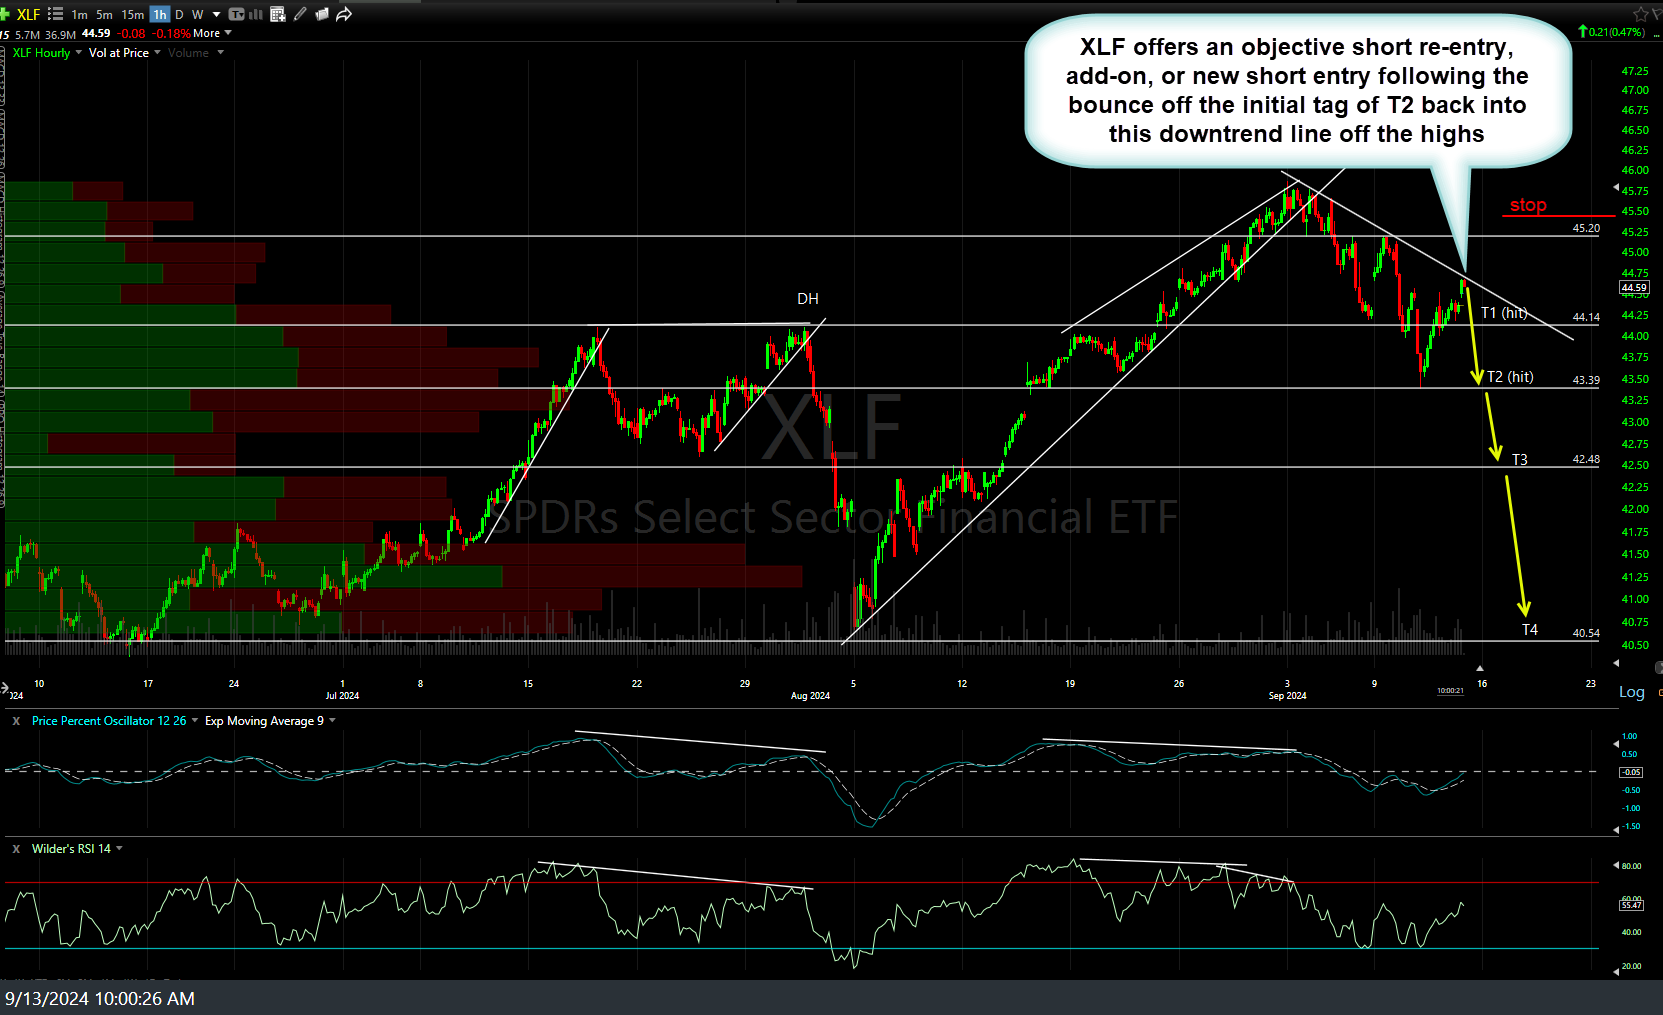
XLF (financial sector ETF) offers an objective short re-entry, add-on, or new short entry following the bounce off the initial tag of T2 back into this downtrend line off the highs. 60-minute chart below.
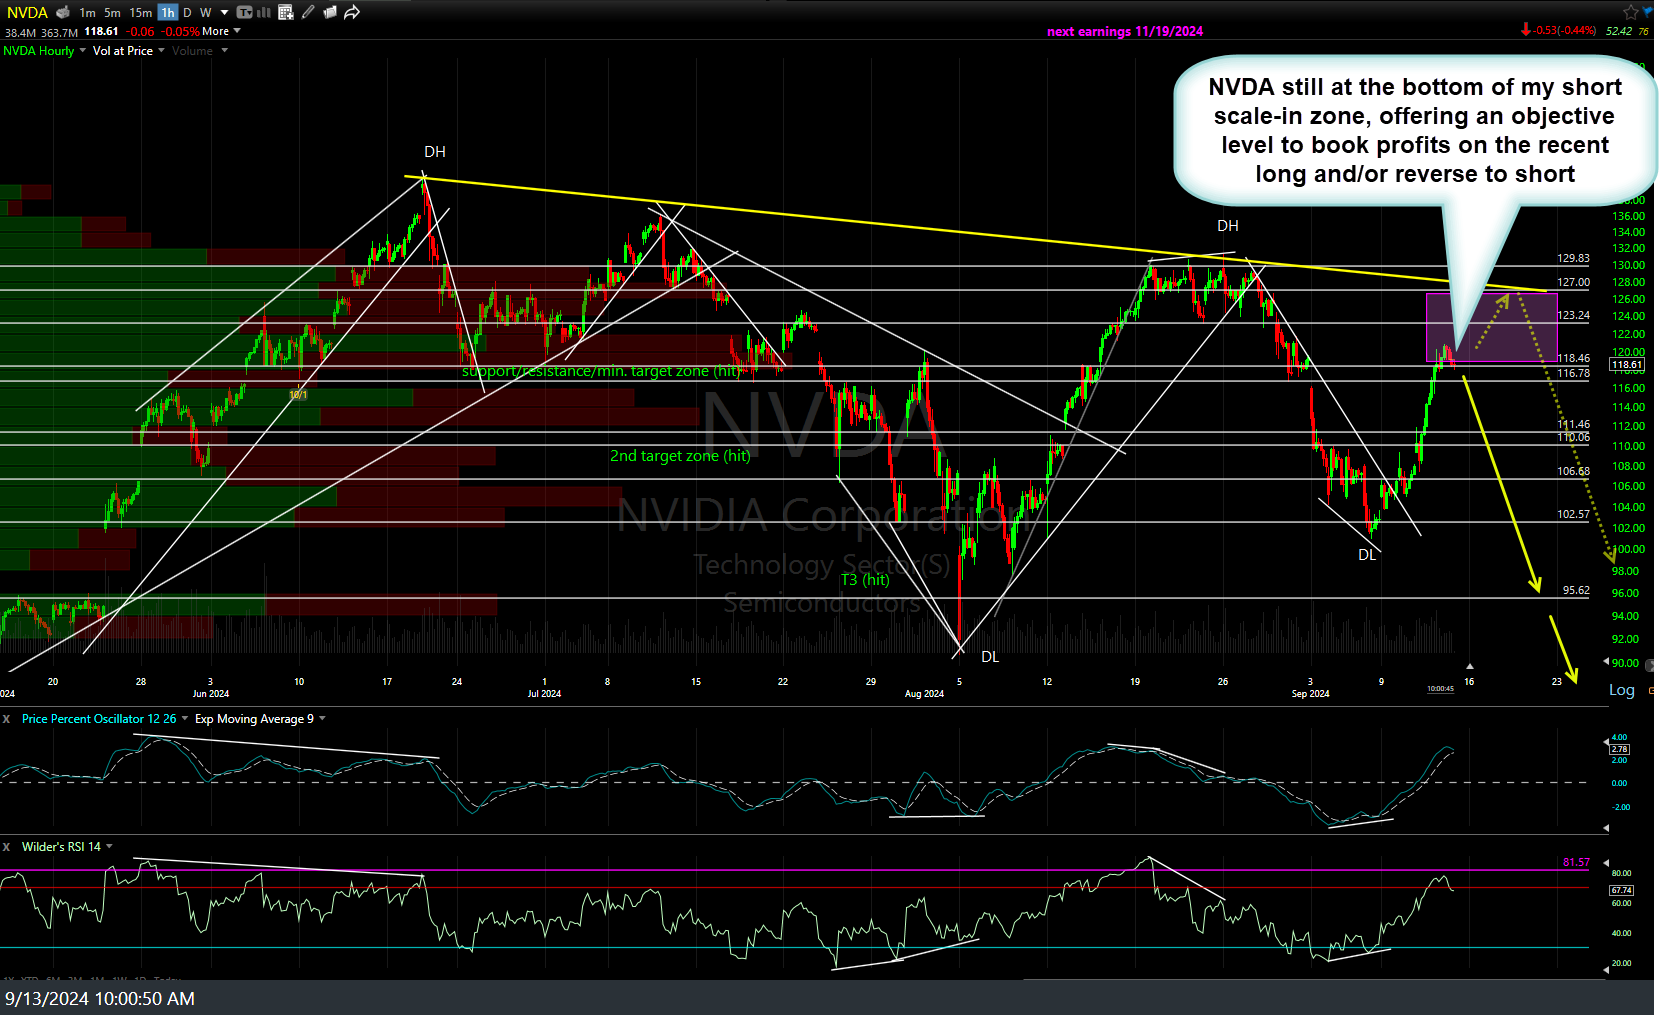
NVDA (NVIDIA Cort) is still at the bottom of my short scale-in zone, offering an objective level to book profits on the recent long and/or reverse to short any where from here up to, but not above the top of the zone (primary downtrend line off the highs). 60-minute chart below.


