
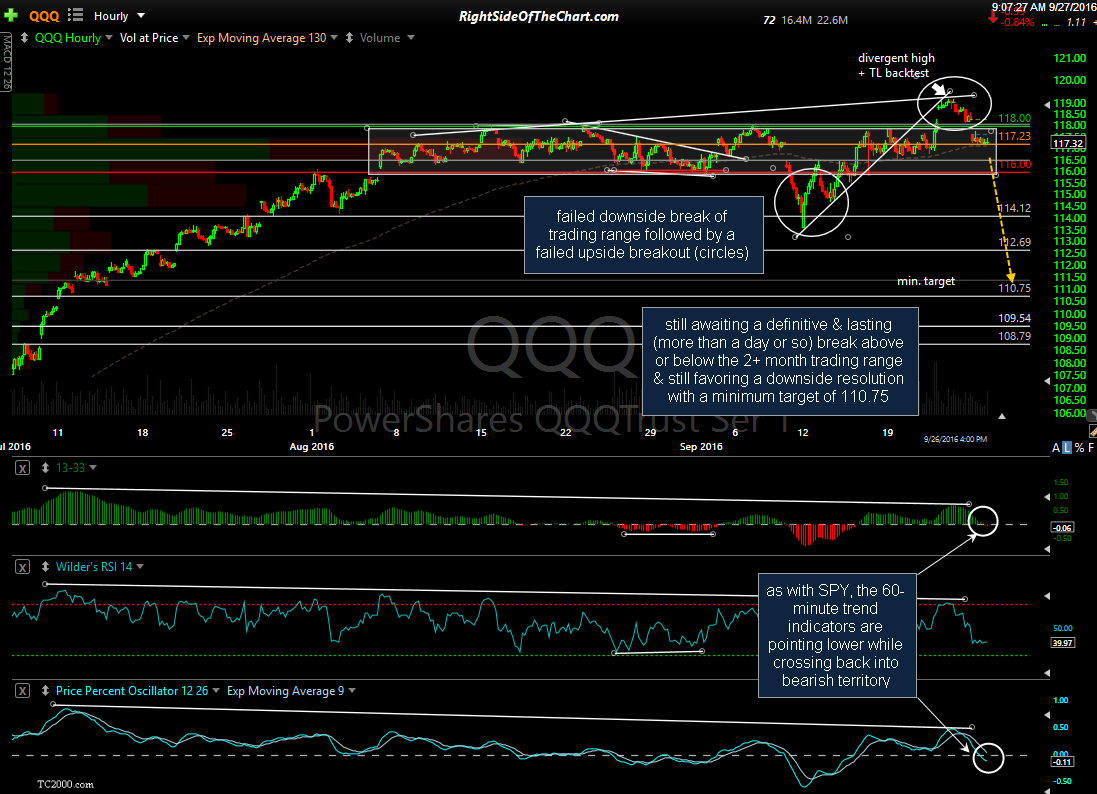
I continue to focus primarily on the 60-minute time frames for the US equity markets as nothing has changed in the longer-term time frames in quite some time. Following a brief whipsaw/false breakdown below the tight sideways trading range that the market has been locked in over the last couple of months, most major stock indices managed to snap-back up inside the trading range with the QQQ (Nasdaq 100 etf) even going to to briefly pop up above the top of the range, only to see prices quickly fall back inside, finding support on the mid-point of the range throughout the trading session yesterday (the mid-point of those ranges in most US indices have acted as support & resistance since throughout the recent trading ranges). Trend indicators have been whippy lately due to the fact the market has been in a sideways trading range for months although it is worth noting the 60-minute indicators are pointed lower & crossing into bearish territory.
-

- QQQ 60-min Sept 26th close
-

- SPY 60-min Sept 26th close
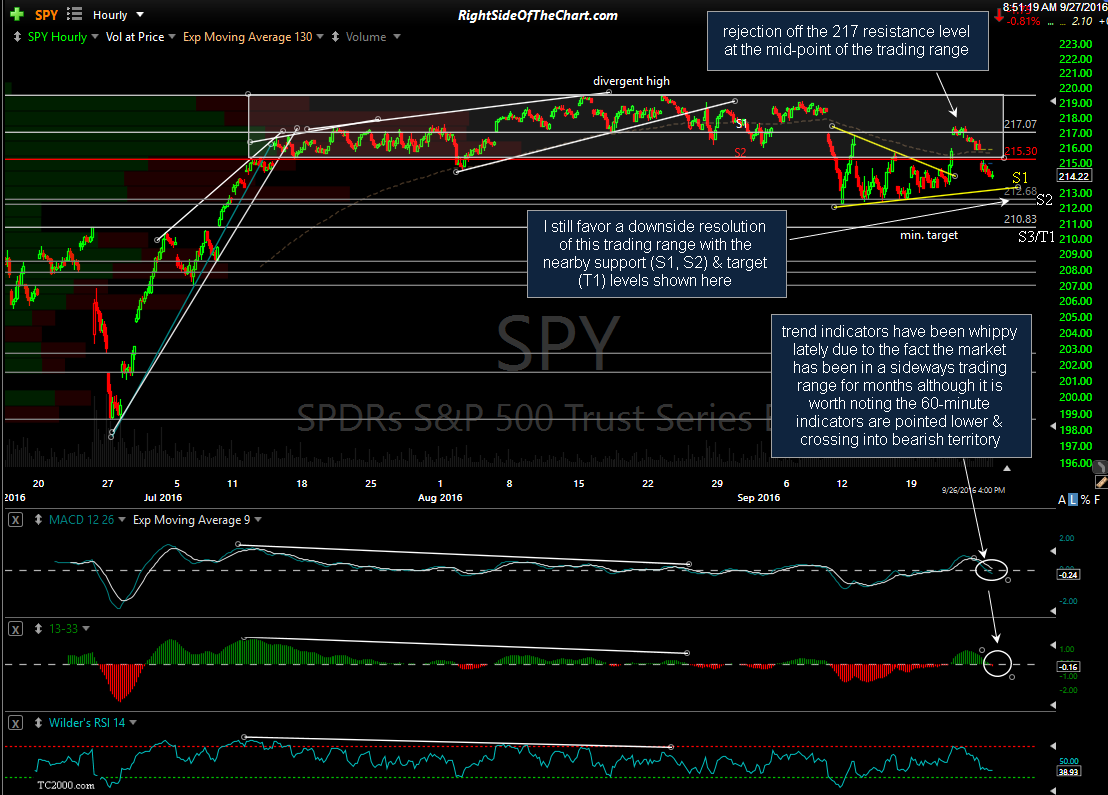
Bottom line: Swing trading has been unusually difficult, both long & short due to the fact the stock market has not only traded in one of the tightest sideways trading ranges in many years but even more so that the leading index, QQQ/$NDX, has experienced not one by two false breakouts (one bearish, one bullish) from the trading range in close proximity lately. Sooner than later this market will pick a direction & the longer-term charts (daily & weekly time frames) still indicate that the next major trend is likely to be to the downside. Until this market makes a definitive break above or below the recent multi-month trading range, swing or trend trading stocks with a fair correlation to the broad market is likely to continue to prove difficult & frustrating but again, such ranges don’t last forever & some of the most powerful & profitable trends to trade are often launch from such tight trading ranges.