
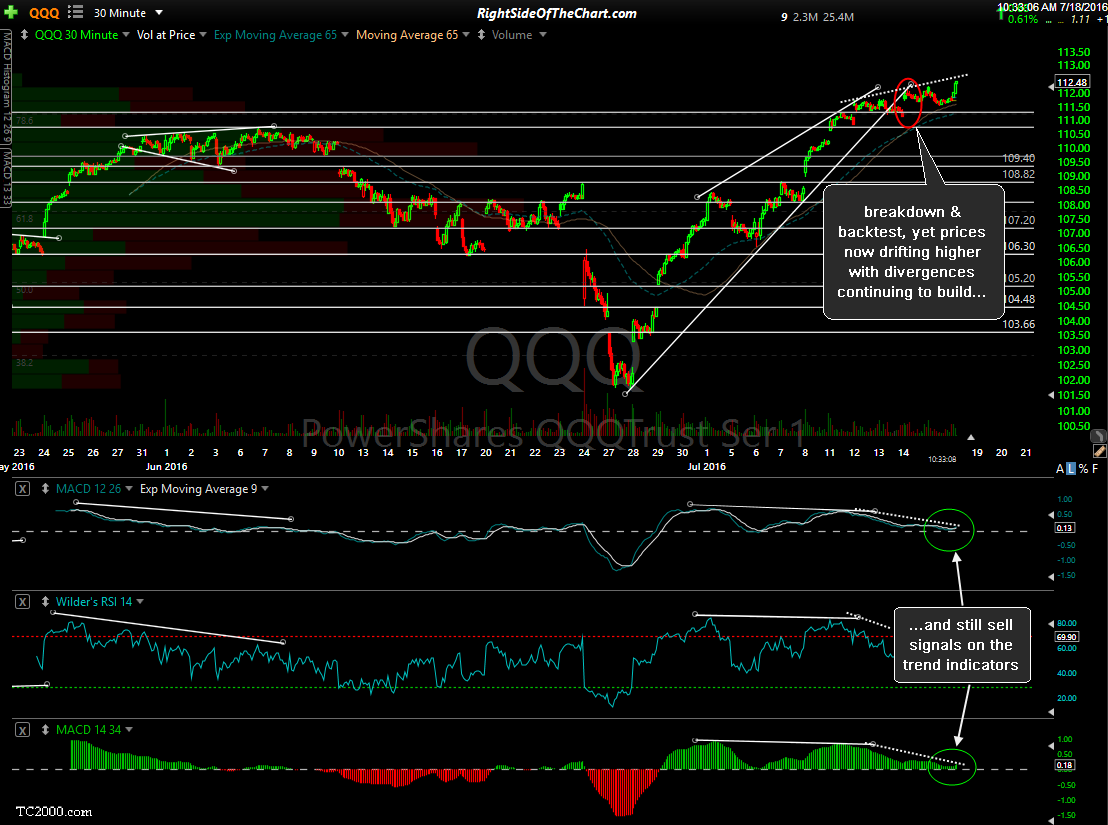
Near-term charts seem to paint a mixed bag of technicals. On one hand, we had the recent breakdowns on the 30-minute rising wedge patterns in QQQ & SPY following a divergent high. However, the trend indicator still remain bullish & with the near-term & intermediate-term trend still clearly bullish, the trend remains bullish until proven otherwise. To confirm a near-term sell signal, we need to see the MACD & 14/34 ema trend indicators flip to bearish on the 30-minute time frame & ideally the 13/33 ema & MACD trend indicators on the 60-minute charts to do the same. Should that happen today (which would require one heck of an intraday reversal) that would also confirm Friday’s bearish engulfing candlesticks.
edit: The annotations on the SPY & QQQ charts below mistakenly list the 30-minute trend indicators as being on sell signals while they are still on buy signals.
-

- SPY 30-minute July 18th

-

- QQQ 30-minute July 18th
The small caps (Russell 2000 Index) still looks the most bullish on the intraday time frames without any divergences in place & the bullish pennant highlighted on Friday looking ready to pop on any more upside in IWM (note, I made a slight revision to the downtrend line on the pennant to adjust for a better fit). As this is a 60-minute chart, best to wait for a 60-minute candlestick close above the pattern, for those looking to position long on a breakout. Personally, I’m going to pass as there are too many mixed signals right now.

IWM 60-minute July 18th
With the recent low volume, the chances of false breakouts, especially on an intraday basis are quite elevated so I’m most concerned with how the markets close today. I’m running a little slow today after one of my monitors died over the weekend but I will be spending the better part of the day in updating the trade ideas and doing my best to find any new trade setups with attractive R/R profiles.