
As I often say, there isn’t a single indicator or sell signal that is 100% effective, not even close. However, technical analysis is all about studying past price & volume history in order to help forecast future price moves as many of those patterns often repeat with similar results. In the past I’ve shared my use of using extreme drops in trading volumes to help identify pullbacks & corrections in the stock market & it seems that once again, an imminent drop in the broad market is likely based on the most recent plunge in trading volumes.
QQQ trading volume sell signals Aug 3rd
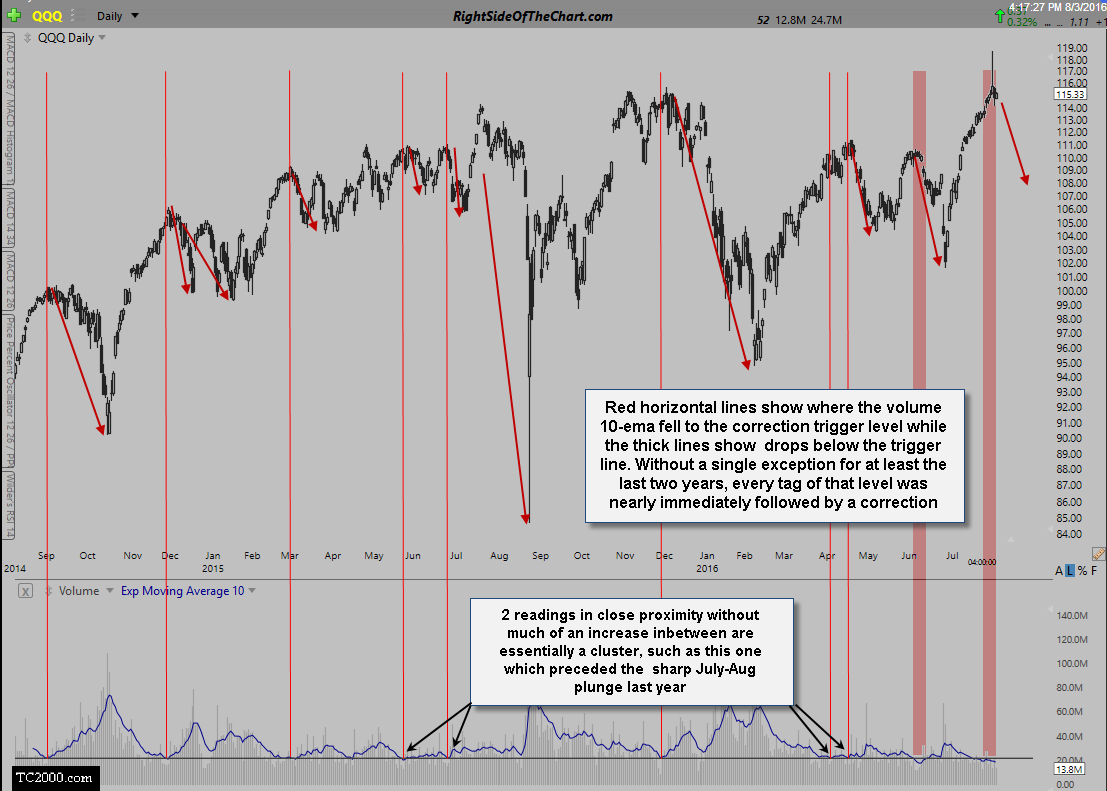
The chart above is a 2-year daily chart of QQQ (Nasdaq 100 Tracking ETF) with a horizontal line placed at the 22,249,980 level, which is simply the bottom of the range (i.e.- support level) of the 10-day exponential moving average of the trading volume in QQQ. In trying to identify extreme drops in volume to help predict trend changes, selloffs in particular, I don’t pay any attention to an unusually low volume reading on any one day, rather I find it much more effective to use a moving average on the volume typically ranging from 5 to 10 days, as this greatly helps to filter out whipsaw signals & also helps highlight a trend of falling trading volumes vs. what might prove to be just a one-day drop, possibly related to an abbreviated or pre/post holiday typical low-volume session.
As the vertical red lines show, every single tag of that level over the last couple of years was nearly immediately followed by a pullback in equities usually lasting a week or more. I also noted the two ‘cluster’ readings over this time period, with a cluster being two tags of the low-volume support line (sell trigger level) in relatively close proximity without any significant increase in volume between the two readings. In fact, the July 20, 2015 top, in which the August flash crash followed shortly afterwards, came just 16 trading sessions after the sell cluster reading in mid-2015.
The two most recent drops to the sell trigger level (including the current reading) have taken the 10-ema down below the line, with the previous reading coming at the peak just before the Brexit selloff. Will this time be different? Anything is possible but as a trader, I play the odds & right now, the odds seem pretty good for a considerable & imminent drop in equities.