
It’s worth mentioning that today’s large gap down on most of major diversified indices may have put Island Cluster Reversal Patterns in place. By most definitions, these patterns are defined by an “island” of candlesticks surrounded by roughly equal gaps on each side. Over the years I have seen many liberties taken to make a chart pattern “fit” a technician’s or trader’s current bias. It is also worth noting that as you read various books on technical analysis or scan the web, you will see nearly endless variations of most price patterns.
-

- island cluster reversal


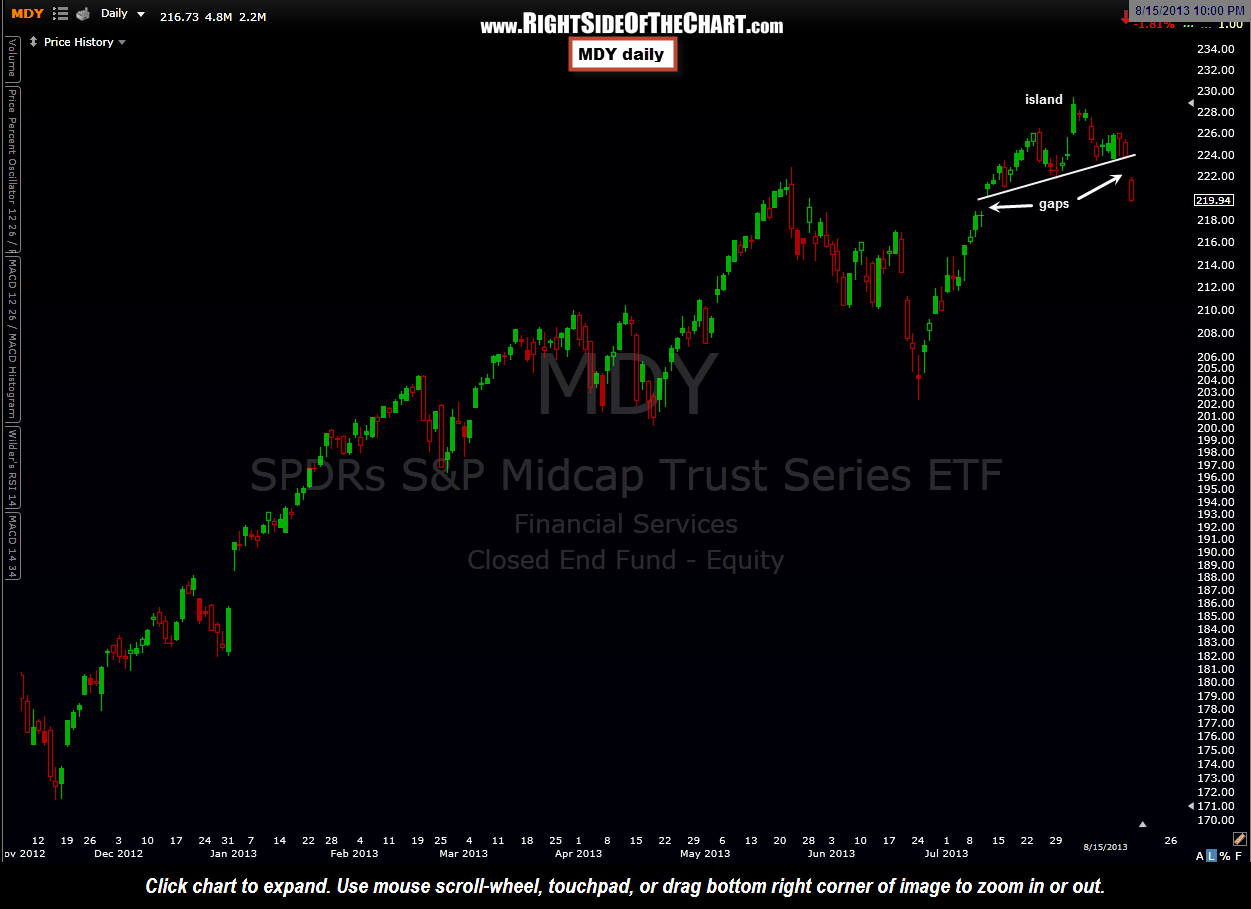
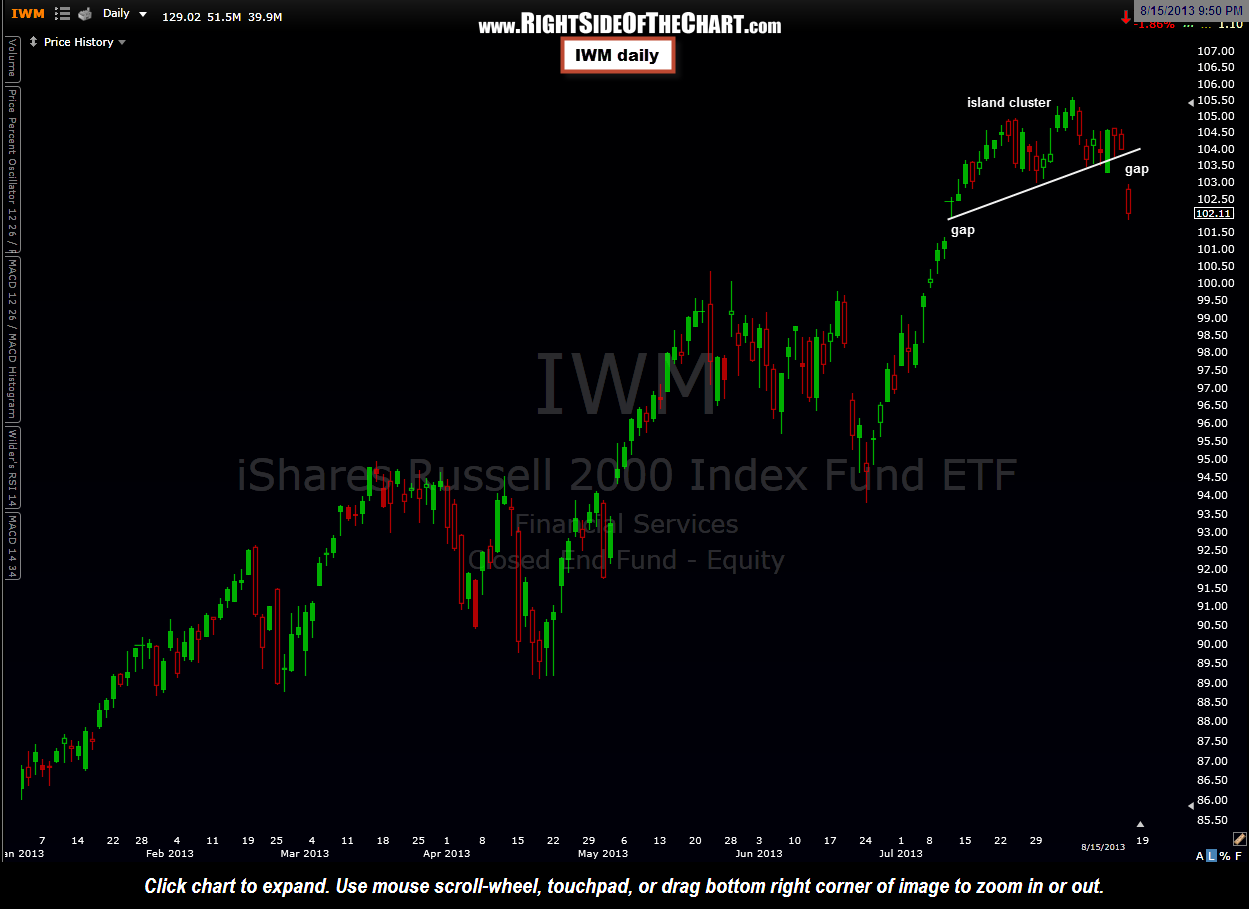
My own take is that the more “clean” the pattern is and the more supporting technical evidence surrounding or supporting the pattern (bearish or bullish), the more likely the pattern is to play out as expected. With that being said, here are the daily charts of the SPY, DIA, MDY, & IWM illustrating what could be interpreted as Island Cluster Reversal patterns on each. The first chart shows a textbook example of the pattern, as discussed above. Although the “islands” recently put in on these charts are defined by an up-sloping trendline vs. the typical flat support line, I believe that the essence of the pattern is still captured based on the price action over the last month or so. However, the next few trading sessions will be key as IF a significant top has been put in place, prices need to remain below today’s gaps and preferably continue to move lower in an impulsive manner over the next several trading sessions. If so, then this rare but often powerful topping pattern will likely signal that we are in the early stages of a much deeper correction. First things first and that would be some additional downside tomorrow & into next week before we can say with a fair degree of confidence that a significant top has been put in.