
TLT (20-30 yr Treasury bond ETF) has broken out above the 60-minute bullish falling wedge pattern, providing an objective entry or add-on to the existing trade that was posted last week. Previous & updated 60-minute charts below.

TLT 60m Dec 23rd

TLT 60m Dec 30th
The 60-minute chart of /ZB (30-yr Treasury bond futures contract) also posted below highlighting the recent breakout & backtest of the 60-minute bullish falling wedge & divergent low on /ZB with the next buy signal to come on a break above 114’023.
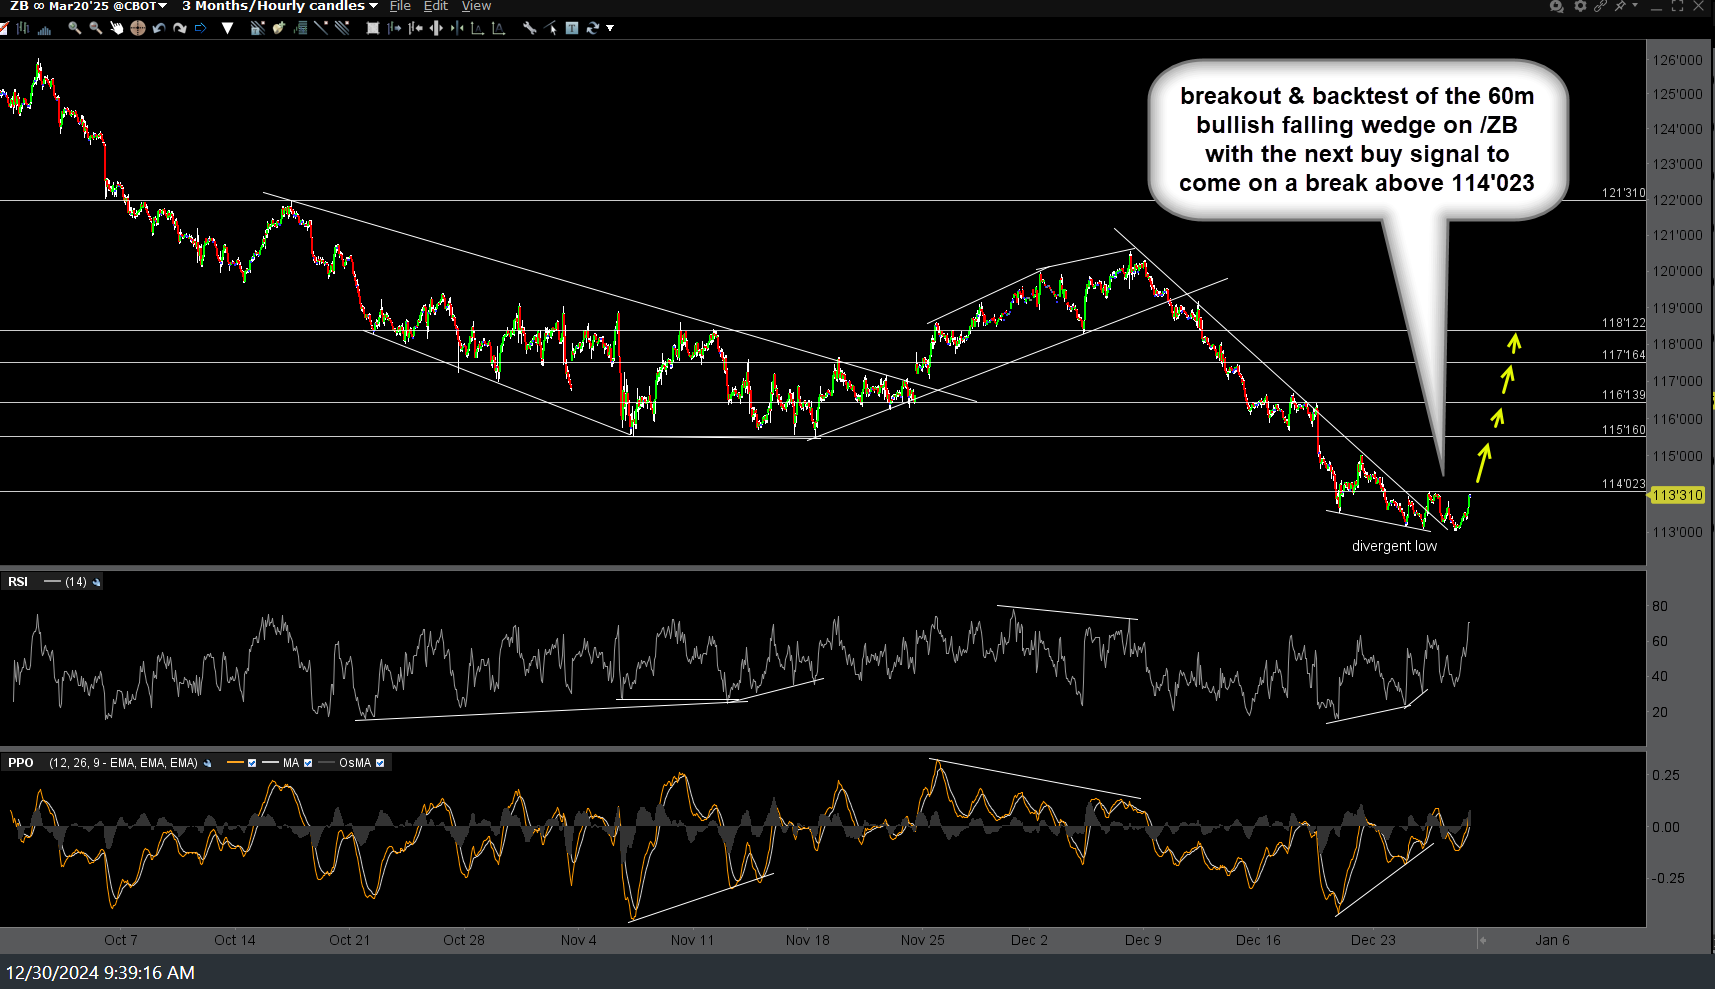
ZB 60m Dec 30th