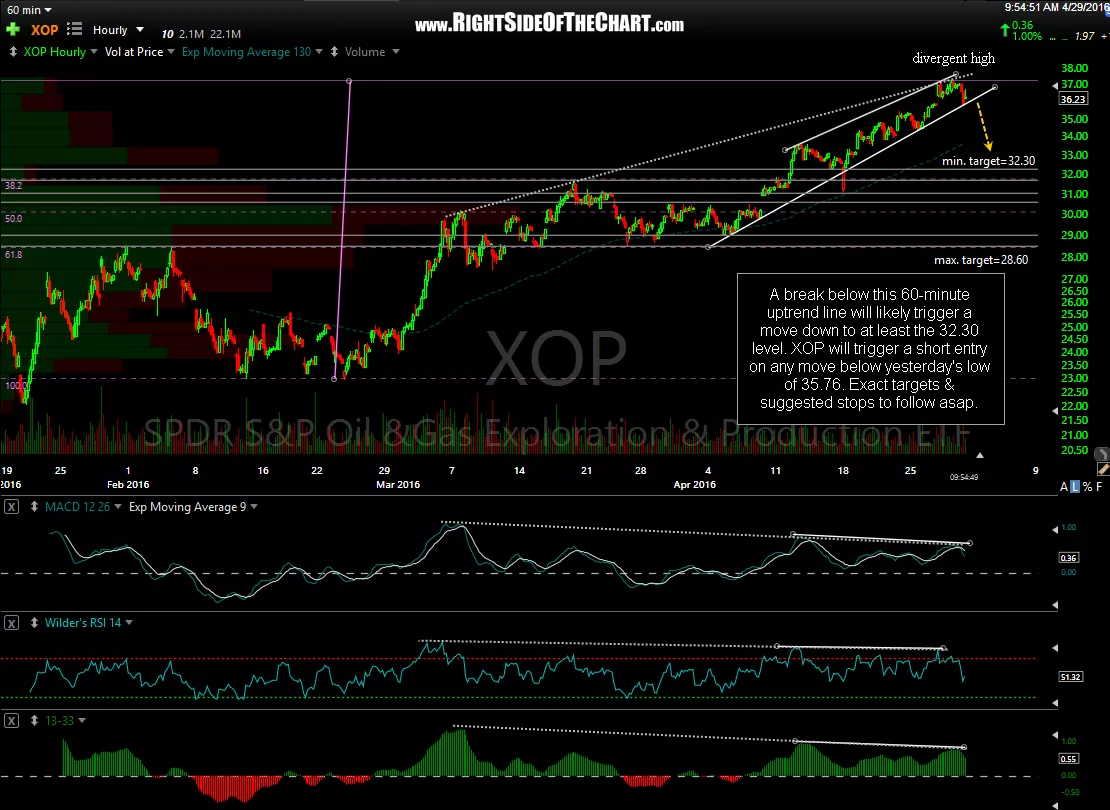
XOP (Oil & Gas Exploration & Production ETF) hit the first target (32.20) on Monday followed by the typical reaction that occurs when a price target is hit & now appears poised for another thrust down towards T2. At the first target price, that provided a gain of 10.1% on the XOP short or a gain of over 30% on my preferred shorting proxy, GUSH (3x bullish Oil & Gas E&P etf). Original & updated 60-minute charts:
-

- XOP 60-minute April 29th
-
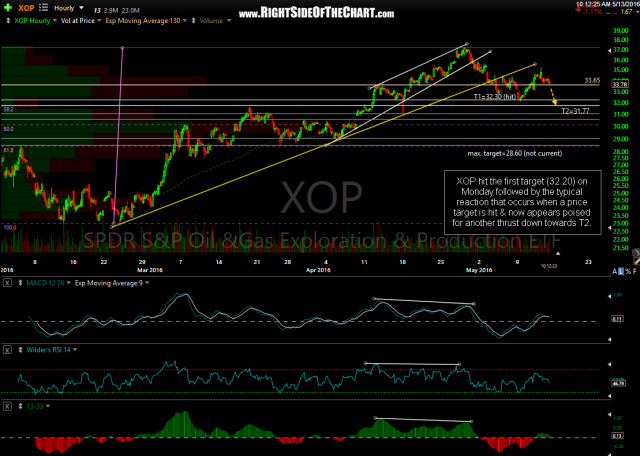
- XOP 60-minute May 13th
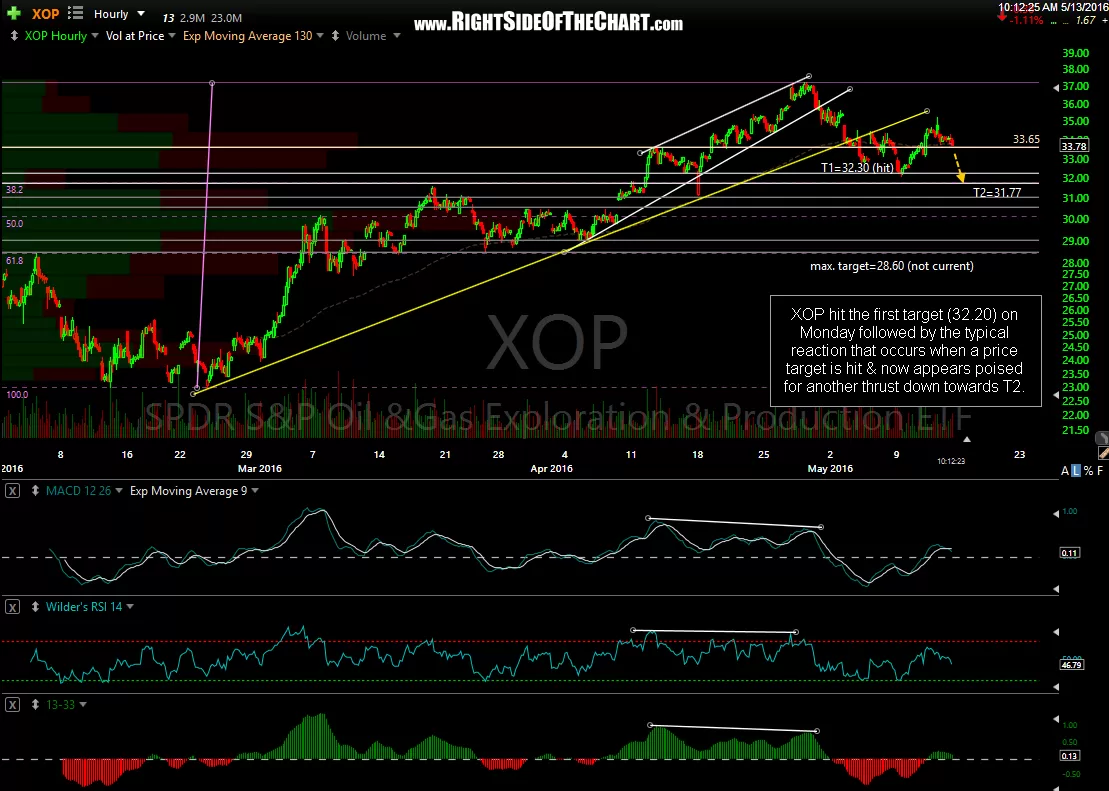
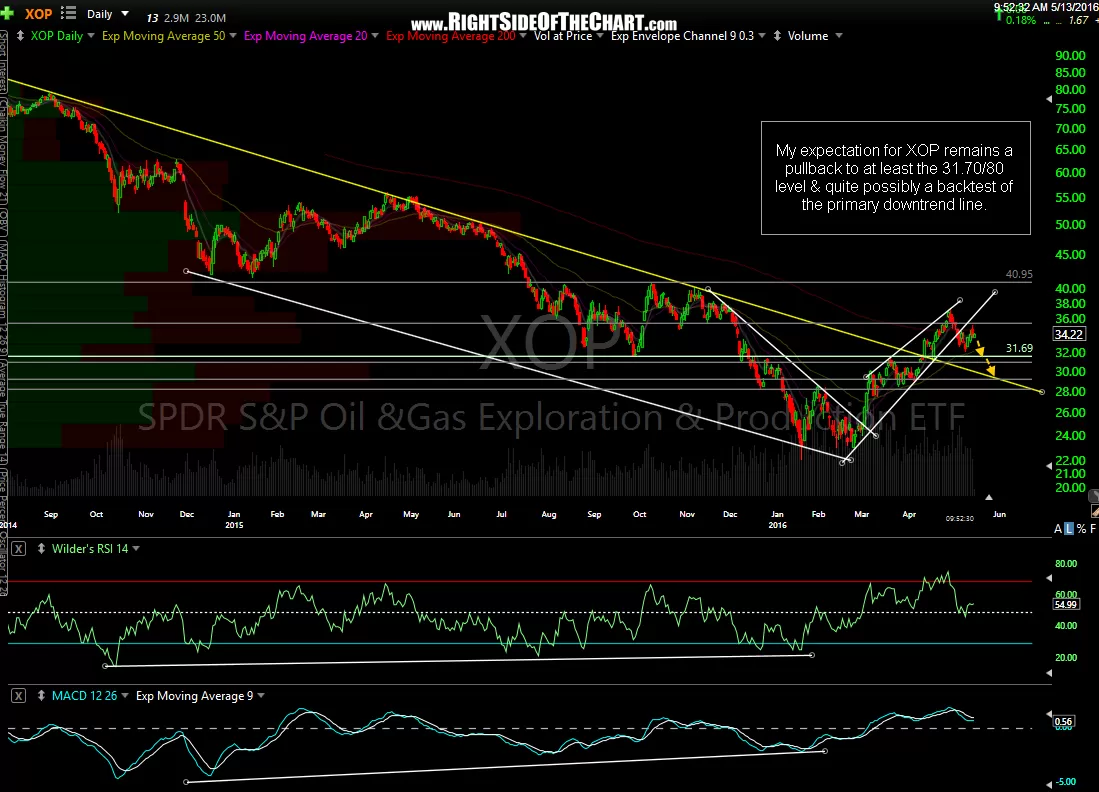
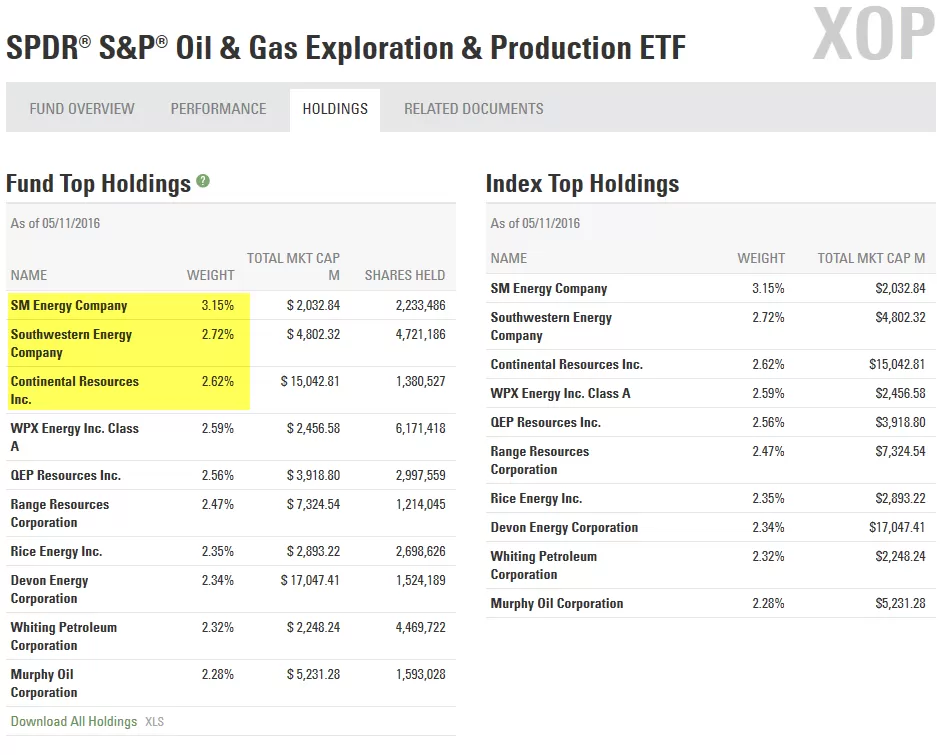
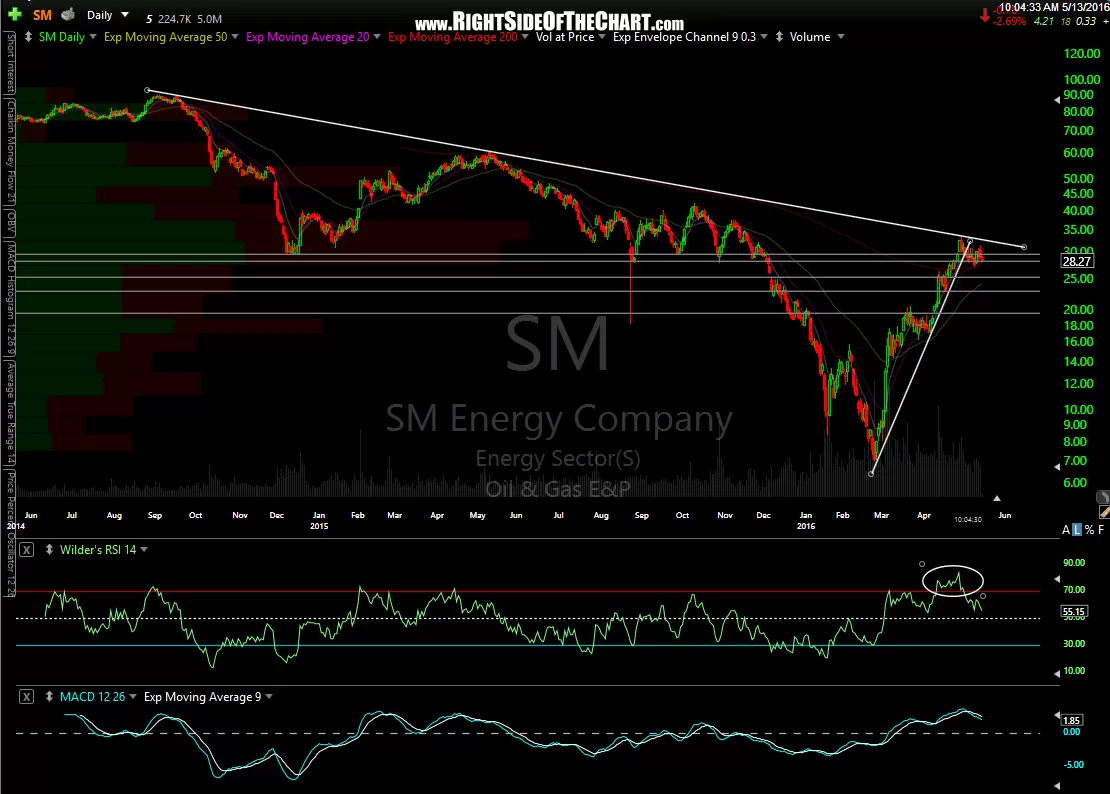
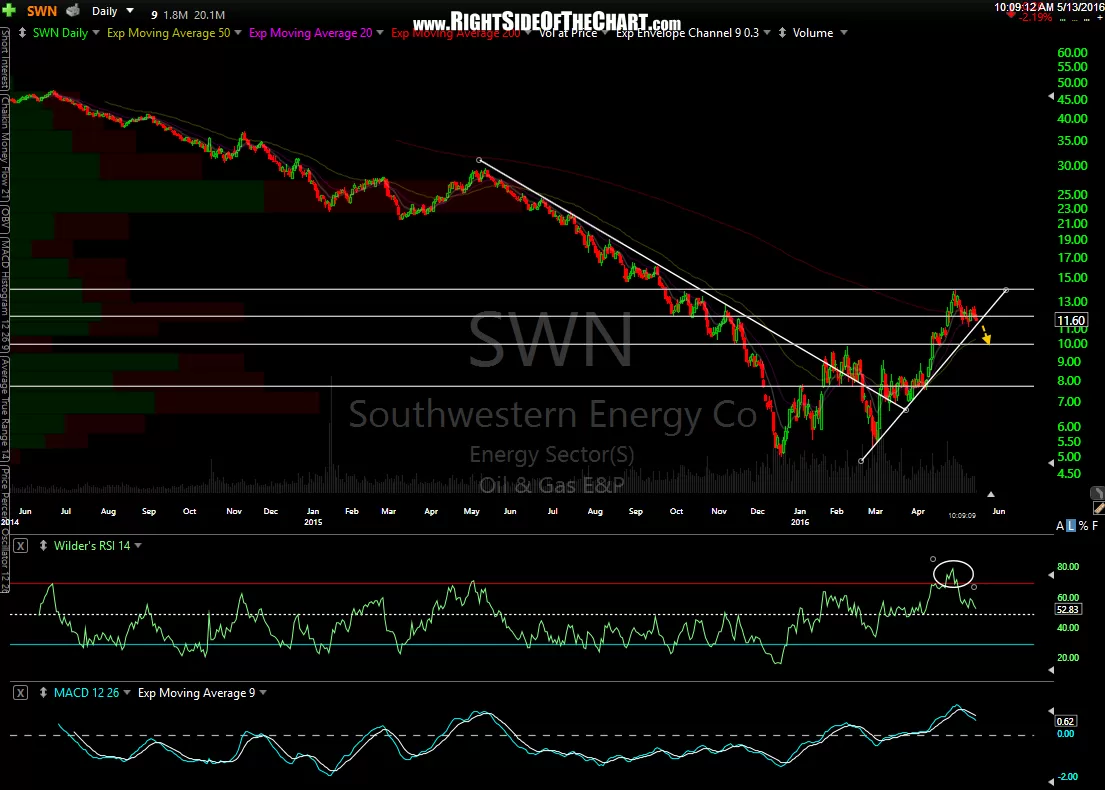
My expectation for XOP remains a pullback to at least the 31.70/80 level & quite possibly a backtest of the primary downtrend line as shown on this daily chart below. My bearish outlook on XOP is as much, if not more, a reflection of my take on the charts of the top components of XOP as it is my read on the XOP chart. Included are the daily charts of the top three holdings in XOP, all of which are coming off an extremely extended run into or near key resistance, all with very steep uptrend lines that have either already been broken or soon will be IMO.
-

- XOP daily May 13th
-

- XOP holdings
-

- SM daily May 13th
-
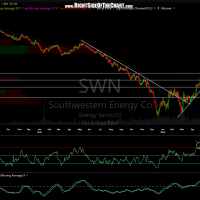
- SWN daily May 13th
-
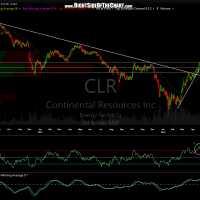
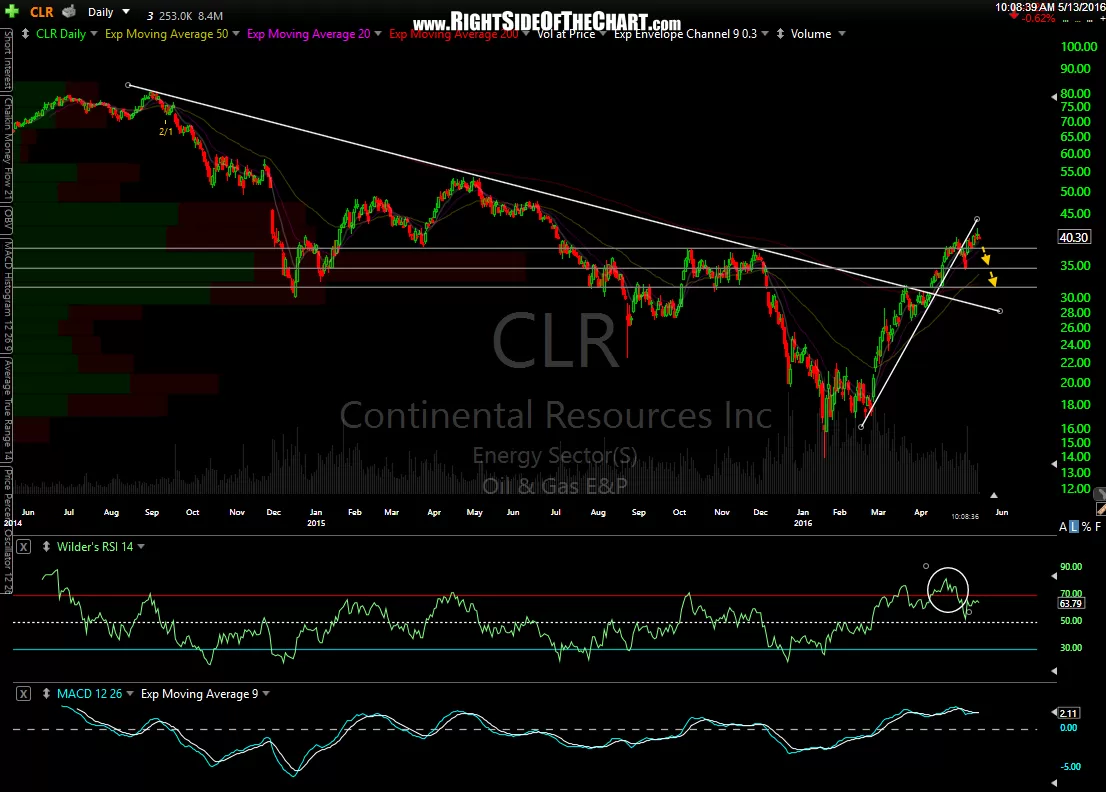
- CLR daily May 13th